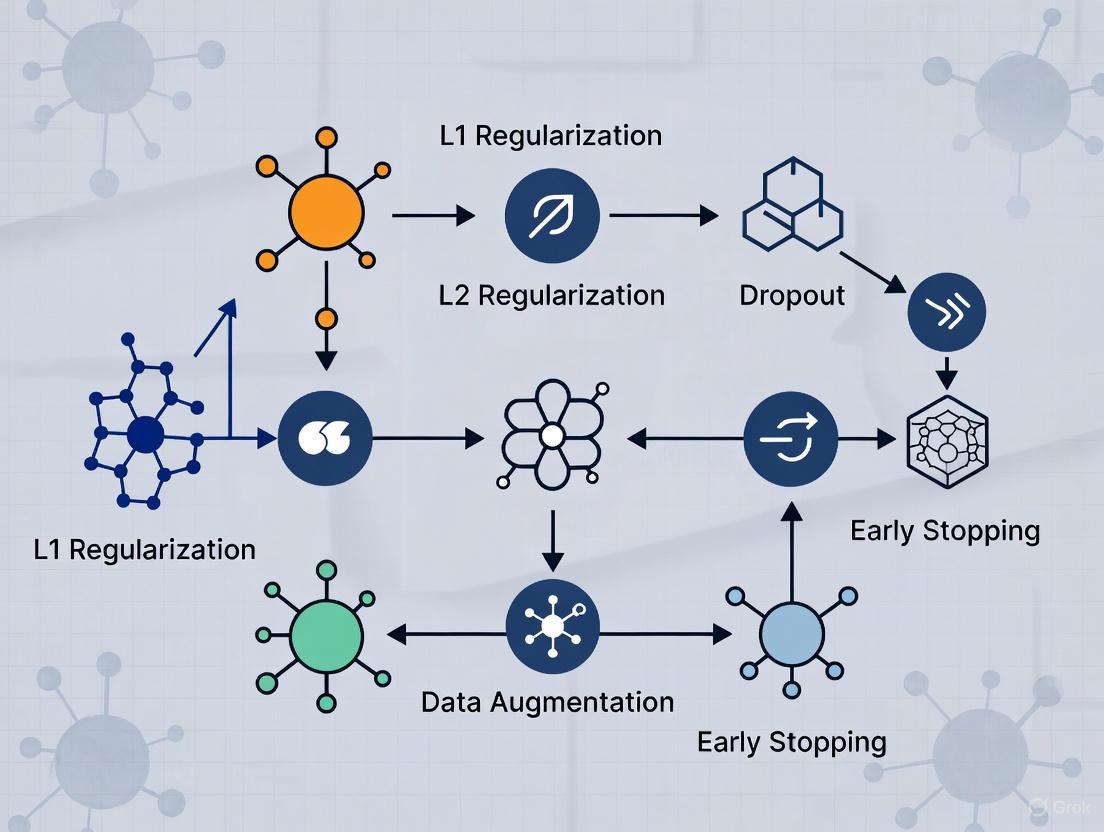
Regularization Techniques to Prevent Overfitting in Biomedical Research and Drug Discovery
This article provides a comprehensive guide to regularization techniques tailored for researchers, scientists, and professionals in drug development.
Regularization Techniques to Prevent Overfitting in Biomedical Research and Drug Discovery
Abstract
This article provides a comprehensive guide to regularization techniques tailored for researchers, scientists, and professionals in drug development. It covers the foundational theory of overfitting and the bias-variance tradeoff, explores the application of methods like L1/L2 regularization and dropout in predictive modeling, offers strategies for troubleshooting and optimizing model performance, and presents a comparative analysis of techniques using validation frameworks and case studies from recent literature. The content is designed to equip readers with the practical knowledge needed to build robust, generalizable machine learning models for critical tasks in biomedicine.
Understanding Overfitting: The Critical Challenge in Predictive Modeling for Drug Discovery
Application Notes and Protocols
1. Definition and Core Challenge
Overfitting is a fundamental challenge in machine learning (ML) and artificial intelligence (AI) where a model learns the training data too well, including its noise and random fluctuations, leading to poor performance on new, unseen data [1] [2]. This occurs when a model becomes overly specialized to its training dataset and fails to generalize, which is the ability to apply learned knowledge to broader, real-world applications [1] [3]. In the context of a thesis on regularization techniques, understanding overfitting is the critical first step, as the primary goal of regularization is to constrain model learning to prevent this memorization of noise and promote the discovery of robust, generalizable patterns [4] [3].
2. Quantitative Evidence and Comparative Data
The impact of overfitting and the efficacy of regularization techniques can be quantitatively measured. The following tables summarize key findings from comparative research.
Table 1: Performance Gap Indicative of Overfitting
| Metric | Training Performance | Validation/Test Performance | Indicator |
|---|---|---|---|
| Accuracy | Exceptionally High (e.g., >95%) | Significantly Lower (e.g., <70%) | Strong evidence of overfitting [1] [2]. |
| Error (Loss) | Consistently Decreases | Plateaus or Increases after a point | The model is memorizing, not generalizing [2]. |
Table 2: Comparative Analysis of Regularization Efficacy in Image Classification
| Model Architecture | Key Regularization Technique | Validation Accuracy | Generalization Improvement Note |
|---|---|---|---|
| Baseline CNN | Dropout, Data Augmentation, Early Stopping | 68.74% | Serves as a baseline for comparison [5] [4]. |
| ResNet-18 | Dropout, Data Augmentation, Early Stopping | 82.37% | Superior architecture benefits from regularization [5] [4]. |
| Generic Model (Theoretical) | L1/L2 Regularization | -- | Can reduce test error by up to 35% and increase model stability by 20% [2]. |
Table 3: Comparison of Advanced Regularization Methods for High-Dimensional Data
| Method | Penalty Type | Key Property | Primary Use Case |
|---|---|---|---|
| LASSO (L1) [3] [6] | L1 (∣β∣) | Performs variable selection; produces sparse models. | High-dimensional data (p > n); feature selection is a priority. |
| Ridge (L2) [3] | L2 (β²) | Shrinks coefficients but does not set them to zero. | Handling multicollinearity; when all predictors are potentially relevant. |
| SCAD [6] | Non-convex | Reduces bias for large coefficients; possesses oracle property. | When unbiased coefficient estimation is critical for large effects. |
| MCP [6] | Non-convex | Similar to SCAD; provides smooth penalty transition. | Alternative non-convex method for variable selection and unbiased estimation. |
3. Experimental Protocols for Detecting and Mitigating Overfitting
The following protocols outline methodologies for identifying overfitting and implementing key regularization techniques within a research framework.
Protocol 1: Baseline Diagnostics for Overfitting Objective: To establish the presence and degree of overfitting in a preliminary model. Materials: Training dataset, validation dataset (hold-out or via cross-validation), computing environment with ML libraries (e.g., TensorFlow, PyTorch, scikit-learn). Procedure:
- Data Splitting: Split the full dataset into training, validation, and test sets (e.g., 70%/15%/15%). The test set must be locked and used only for final evaluation [2].
- Model Training: Train a model with sufficient complexity on the training set. Record loss and accuracy metrics epoch-by-epoch.
- Validation Monitoring: Simultaneously, evaluate the model on the validation set after each training epoch (or at regular intervals) to record its performance.
- Learning Curve Analysis: Plot the training and validation loss/accuracy curves against training epochs. A defining characteristic of overfitting is a persistent and widening gap between the two curves, where training loss continues to decrease while validation loss stagnates or increases [1] [2].
- Performance Gap Calculation: Quantify the generalization gap (e.g.,
Training Accuracy - Validation Accuracy). A large gap confirms overfitting.
Protocol 2: Implementing Cross-Validation for Robust Evaluation Objective: To obtain a reliable estimate of model generalization error and mitigate overfitting induced by a single, fortunate data split. Methodology: K-Fold Cross-Validation [1] [6]. Procedure:
- Partitioning: Randomly shuffle the dataset and partition it into k (typically 5 or 10) mutually exclusive subsets (folds) of approximately equal size.
- Iterative Training/Validation: For each iteration i (from 1 to k): a. Use fold i as the validation set. b. Use the remaining k-1 folds as the training set. c. Train the model and evaluate on the validation fold.
- Aggregation: The final performance estimate is the average of the performance scores from the k iterations. This protocol ensures the model is evaluated on diverse data slices, providing a more robust measure of its ability to generalize [1].
Protocol 3: Applying L1 (LASSO) and L2 (Ridge) Regularization
Objective: To prevent overfitting by adding a penalty term to the model's loss function, discouraging overly complex parameter values [3].
Theoretical Basis: The regularized loss function is: Loss = Base_Loss (e.g., MSE) + λ * Penalty(β), where λ is the regularization strength hyperparameter.
Procedure for L1 (LASSO):
- Modify Loss Function: Use the L1 penalty:
Penalty(β) = Σ |β_j|. This encourages sparsity, driving some parameters to exactly zero, effectively performing feature selection [3] [6]. - Hyperparameter Tuning: Use cross-validation (Protocol 2) to select the optimal value for
λ. A higherλincreases regularization strength. - Model Training: Train the model by minimizing the regularized loss function.
- Analysis: Examine the final model coefficients. Many will be zero, indicating the corresponding features were deemed non-essential by the model.
Procedure for L2 (Ridge):
- Modify Loss Function: Use the L2 penalty:
Penalty(β) = Σ β_j². This shrinks all coefficients proportionally but does not set them to zero, helping manage multicollinearity [3]. - Hyperparameter Tuning: Similarly, tune
λvia cross-validation. - Model Training: Train the model to minimize the regularized loss.
Protocol 4: Implementing Dropout in Neural Networks Objective: To reduce co-adaptation of neurons and create an implicit ensemble of subnetworks, thereby improving generalization [5] [4]. Materials: A neural network architecture (e.g., CNN, ResNet). Procedure:
- Layer Modification: During training, for a specified dropout rate p (e.g., 0.5), randomly "drop" (set to zero) the outputs of each neuron in the designated layer(s) for each training sample.
- Training: Only the non-dropped neurons are updated via backpropagation for that iteration. This process is repeated stochastically every iteration.
- Inference/Testing: During evaluation, dropout is turned off, and all neuron outputs are used, typically scaled by (1-p) to maintain expected output magnitudes.
4. The Scientist's Toolkit: Research Reagent Solutions
Table 4: Essential Computational Tools and "Reagents" for Overfitting Research
| Item/Module | Function in Experiment | Example (from Protocols) |
|---|---|---|
| Training/Validation/Test Sets | The foundational substrate. Training set teaches the model, validation set tunes hyperparameters and diagnoses overfitting, test set provides final, unbiased evaluation [2]. | Created via train_test_split in scikit-learn [3]. |
| K-Fold Cross-Validator | A tool for robust performance estimation and hyperparameter tuning, mitigating variance from data splitting [6]. | KFold or GridSearchCV in scikit-learn. |
| Regularization Hyperparameter (λ/α) | The "dose" of regularization. Controls the trade-off between fitting the data and model simplicity [3] [6]. | Tuned via cross-validation in Lasso (alpha) [3]. |
| Dropout Layer | A structural "inhibitor" for neural networks that stochastically deactivates neurons during training to prevent co-adaptation [5] [4]. | torch.nn.Dropout in PyTorch; tf.keras.layers.Dropout in TensorFlow. |
| Early Stopping Callback | A monitoring agent that halts training when validation performance degrades, preventing the model from learning noise in later epochs [1] [4]. | EarlyStopping callback in Keras/TensorFlow. |
| Data Augmentation Pipeline | A method to synthetically expand and diversify the training data, exposing the model to more variations and reducing memorization of specific samples [2] [4]. | Includes operations like rotation, flipping, cropping (e.g., torchvision.transforms). |
5. Visualization of Concepts and Workflows
Diagram 1: The Generalization vs. Overfitting Paradigm (88 chars)
Diagram 2: Iterative Research Workflow with Regularization (99 chars)
Diagram 3: K-Fold Cross-Validation Procedure (k=5) (73 chars)
Overfitting represents a fundamental challenge in the application of machine learning (ML) and artificial intelligence (AI) to clinical research and drug development. An overfit model performs well on its training data but fails to generalize to new, unseen datasets, a critical flaw when patient safety and billion-dollar development decisions are at stake. In high-stakes clinical environments, this statistical error translates directly to financial losses, patient risks, and failed clinical trials [7]. Regularization techniques, which prevent overfitting by penalizing model complexity, have therefore become essential for developing robust, generalizable, and trustworthy AI applications in healthcare [7]. This Application Note examines the tangible consequences of overfitting and provides structured protocols for implementing regularization to safeguard drug safety and clinical trial integrity.
Quantifying the Impact: Overfitting in Clinical and Safety Contexts
The table below summarizes empirical findings on AI/ML performance and failure rates in clinical and safety applications, highlighting domains where overfitting poses significant risks.
Table 1: Performance and Risk Indicators in Clinical AI Applications
| Application Domain | Reported Performance (AUC/F-score) | Key Risks & Failure Contexts | Data Source |
|---|---|---|---|
| Adverse Event (ADE) Prediction | AUC up to 0.96 [8] | High false positive rates with early algorithms (e.g., BCPNN); challenges with rare events and drug interactions [9] | FAERS, EHRs, Spontaneous Reports [9] [8] |
| Toxicity Prediction (e.g., DILI) | High-performance models in research (specific metrics not consolidated) [8] | Failure to generalize across diverse patient populations and drug classes; high cost of late-stage attrition [10] [8] | Preclinical data, Molecular structures [8] |
| Trial Operational Risk | AI models used for prediction (specific metrics not consolidated) [8] | Inaccurate prediction of patient recruitment or phase transition success, leading to costly protocol amendments and delays [11] [8] | Trial protocols, Historical trial data [8] |
| Drug-Gene Interaction | AUC 0.947, F1-score 0.969 [12] | Poor generalizability to new drug candidates or diverse patient omics-profiles invalidates discovery efforts [12] | Transcriptomic data (e.g., NCBI GEO) [12] |
The financial implications of these failures are substantial. Late-stage clinical trial failures are a primary driver of development costs, with 40-50% of Phase III trials failing despite representing the most expensive stage, costing between $31 million and over $214 million per trial [10]. These costs are ultimately passed on, contributing to higher drug prices. Furthermore, in pharmacovigilance, models prone to overfitting may generate excessive false positive signals, overwhelming safety review teams and potentially causing either harmful delays in signal detection or costly misdirection of resources [9].
Regularization Techniques: Core Protocols for Robust Models
Regularization techniques are essential for developing models that generalize well to real-world clinical data. The following protocols detail key methodologies.
Protocol: Standard Regularization Techniques for Predictive Model Development
This protocol outlines the application of L1 (Lasso), L2 (Ridge), and Elastic Net regularization to prevent overfitting in clinical predictive models [7].
- 3.1.1 Application Scope: Suitable for supervised learning tasks, including classification (e.g., serious adverse event prediction) and regression (e.g., predicting continuous biomarker levels).
- 3.1.2 Materials and Reagents:
- Software: Python with scikit-learn, TensorFlow, or PyTorch.
- Computing Environment: Standard workstation or high-performance computing cluster for large datasets.
- 3.1.3 Step-by-Step Procedure:
- Data Preprocessing: Split data into training, validation, and test sets. Perform feature scaling (e.g., standardization) to ensure regularization penalties are applied uniformly.
- Model Definition: Integrate the regularization term into the model's loss function.
- For L1 Regularization, add the sum of the absolute values of the model coefficients:
Loss = Original_Loss + λ * Σ|coefficient|. - For L2 Regularization, add the sum of the squared values of the model coefficients:
Loss = Original_Loss + λ * Σ(coefficient^2). - For Elastic Net, combine L1 and L2:
Loss = Original_Loss + λ1 * Σ|coefficient| + λ2 * Σ(coefficient^2).
- For L1 Regularization, add the sum of the absolute values of the model coefficients:
- Hyperparameter Tuning (λ): Use cross-validation on the training set to find the optimal regularization strength (λ). This parameter controls the trade-off between fitting the training data and model simplicity.
- Model Training: Train the model on the training set using the tuned hyperparameters.
- Model Validation: Evaluate the final model's performance on the held-out test set to estimate real-world performance.
- 3.1.4 Interpretation Guidelines:
- L1 (Lasso) is highly effective for feature selection, as it can drive coefficients of non-informative features to zero [7].
- L2 (Ridge) tends to shrink coefficients uniformly but does not zero them out, making it suitable when most features are relevant.
- Elastic Net is advantageous when dealing with highly correlated features, a common scenario in genomics and transcriptomics data [12].
Protocol: Advanced Regularization in Deep Learning for Drug Discovery
This protocol addresses overfitting in complex deep learning models used in discovery, such as those predicting drug-gene interactions [12].
- 3.2.1 Application Scope: Deep neural networks (DNNs) for high-dimensional data analysis (e.g., multi-omics data, chemical structures).
- 3.2.2 Materials and Reagents:
- Software: TensorFlow/Keras or PyTorch.
- Data: Large-scale biological datasets (e.g., transcriptomics from NCBI GEO, chemical libraries).
- 3.2.3 Step-by-Step Procedure:
- Model Architecture Design: Implement a feedforward neural network. For a study predicting drug-gene interactions on tight junction integrity, a network with three hidden layers of 64 nodes each was effective [12].
- Integrate Dropout Regularization: During training, randomly "drop out" (i.e., temporarily remove) a proportion (e.g., 30%) of the nodes in each layer in each training batch. This prevents complex co-adaptations of neurons on training data [12].
- Early Stopping: Monitor the model's performance on a validation set during training. Halt training when validation performance stops improving, preventing the model from over-optimizing to the training data.
- Explainability Analysis: Apply Explainable AI (XAI) methods like SHAP (SHapley Additive exPlanations) or LIME (Local Interpretable Model-agnostic Explanations) post-training to validate that the model's predictions are based on biologically plausible features [12].
Diagram: Workflow for Developing a Regularized Deep Learning Model in Drug Discovery
The Scientist's Toolkit: Research Reagent Solutions
The following table catalogues key computational and data resources essential for implementing robust, regularized models in clinical and discovery research.
Table 2: Essential Research Reagents for Regularized Model Development
| Reagent / Resource | Function / Application | Implementation Example |
|---|---|---|
| scikit-learn Library | Provides implementations of L1, L2, and Elastic Net regularization for traditional ML models. | sklearn.linear_model.LogisticRegression(penalty='l1', C=1.0) |
| TensorFlow / PyTorch | Deep learning frameworks that support Dropout, L2 weight decay, and other advanced regularization. | tf.keras.layers.Dropout(0.3) for 30% dropout [12]. |
| SHAP / LIME Libraries | Explainable AI (XAI) tools for interpreting complex models and validating feature importance. | Post-hoc analysis of a DNN to ensure predicted drug-gene interactions are biologically plausible [12]. |
| Stratified Train/Val/Test Splits | Ensures representative distribution of classes across data splits, critical for unbiased evaluation. | Splitting clinical trial data to maintain similar proportions of responders/non-responders in all sets. |
| Cross-Validation Pipelines | Robust method for hyperparameter tuning (e.g., finding optimal λ) without leaking test data information. | Using 5-fold cross-validation to tune the regularization strength of a Ridge regression model. |
A Framework for Safe Implementation: From Validation to Deployment
To ensure AI/ML tools are safely integrated into clinical and development workflows, a phased, "clinical trials-informed" framework is recommended [13]. This approach systematically assesses safety and efficacy before full deployment.
Diagram: Phased Framework for AI Implementation in Healthcare
- Phase 1: Safety (Silent Mode & Bias Testing): The model is executed retrospectively or in "silent mode" where its predictions are logged but do not influence clinical decisions. This phase includes rigorous bias and fairness analyses across patient demographics to ensure the model does not perpetuate or amplify health disparities [13].
- Phase 2: Efficacy (Background Execution): The model processes real-time data in a live clinical environment, but its outputs remain hidden from end-users. This allows researchers to evaluate performance under real-world conditions and refine data pipelines and workflows without patient risk [13].
- Phase 3: Effectiveness (Pragmatic Comparison): The tool is deployed to a limited set of users to evaluate its effectiveness compared to the current standard of care. The focus shifts from pure accuracy to impact on real-world health outcomes and clinician workflows [13].
- Phase 4: Monitoring (Post-Deployment Surveillance): Following scaled deployment, the model undergoes continuous surveillance to detect model drift (deterioration in performance due to changes in underlying data) and to gather user feedback for iterative improvement [13].
Overfitting is not merely a statistical nuance but a critical vulnerability that can compromise patient safety, derail clinical trials, and inflate drug development costs. The disciplined application of regularization techniques—from foundational L1/L2 methods to advanced strategies like dropout in deep learning—is paramount for building reliable AI models. By integrating these techniques within a structured implementation framework that emphasizes phased testing and continuous monitoring, researchers and drug developers can mitigate these risks. This rigorous approach ensures that AI and ML tools fulfill their promise of accelerating drug discovery and improving patient outcomes without introducing new perils.
In the pursuit of developing robust predictive models, the bias-variance tradeoff represents a fundamental concept that governs a model's ability to generalize to unseen data. This framework is particularly crucial in scientific domains such as drug development, where model performance directly impacts research validity and decision-making processes. The tradeoff emerges from the tension between two error sources: bias, resulting from overly simplistic model assumptions, and variance, arising from excessive sensitivity to training data fluctuations [14] [15].
When models exhibit high bias, they underfit the data, failing to capture underlying patterns and demonstrating poor performance on both training and validation sets. Conversely, models with high variance overfit the data, learning noise as if it were signal and consequently performing well on training data but poorly on unseen data [16]. Understanding this balance is essential for researchers implementing regularization techniques to prevent overfitting while maintaining model capacity to detect genuine biological signals.
This article establishes the theoretical foundation of the bias-variance decomposition, provides experimental protocols for its evaluation, and presents visualization frameworks to guide researchers in optimizing model performance for scientific applications.
Theoretical Foundation
Mathematical Decomposition
The bias-variance tradeoff can be mathematically formalized through the decomposition of the expected prediction error. For a given test point ( x0 ) with observed value ( y0 = f(x0) + \epsilon ) (where ( \epsilon ) represents irreducible error with mean zero and variance ( \sigma^2 )), the expected prediction error of a model ( \hat{f}(x0) ) can be expressed as:
[ \text{Error}(x0) = \text{Bias}^2[\hat{f}(x0)] + \text{Var}[\hat{f}(x_0)] + \sigma^2 ]
Where:
- Bias = ( \mathbb{E}[\hat{f}(x0)] - f(x0) ) → Error from simplistic assumptions
- Variance = ( \mathbb{E}[(\hat{f}(x0) - \mathbb{E}[\hat{f}(x0)])^2] ) → Error from sensitivity to data fluctuations
- ( \sigma^2 ) → Irreducible error inherent in the data generation process [15]
This decomposition reveals that to minimize total prediction error, researchers must balance the reduction of both bias and variance, as decreasing one typically increases the other.
Conceptual Framework in Model Selection
The behavior of bias and variance across model complexity follows a predictable pattern that guides model selection strategies:
As model complexity increases, bias decreases as the model becomes more flexible in capturing underlying patterns. However, variance simultaneously increases as the model becomes more sensitive to specific training data instances. The optimal model complexity occurs at the point where total error is minimized, balancing these competing objectives [15] [16].
Quantitative Analysis
Error Comparison Across Model Types
The following table summarizes the characteristic performance patterns across the bias-variance spectrum, providing researchers with diagnostic indicators for model assessment:
Table 1: Model Performance Characteristics Across the Bias-Variance Spectrum
| Model Characteristic | High Bias (Underfitting) | High Variance (Overfitting) | Balanced (Ideal) |
|---|---|---|---|
| Training Error | High | Very Low | Low |
| Testing Error | High | High | Low |
| Model Complexity | Too Simple | Too Complex | Appropriate |
| Primary Symptom | Fails to capture data patterns | Memorizes training data noise | Captures patterns without noise |
| Typical Accuracy Pattern | Training: ~65%, Test: ~60% [17] | Training: ~97%, Test: ~75% [17] | Training & Test: Similarly High |
| Data Utilization | Insufficient pattern learning | Excessive noise learning | Optimal pattern extraction |
Polynomial Regression Case Study
Polynomial regression provides a clear experimental demonstration of the bias-variance tradeoff, where model complexity is controlled through the polynomial degree. The following quantitative results illustrate this relationship:
Table 2: Error Analysis Across Polynomial Degrees in Regression Modeling
| Polynomial Degree | Training MSE | Testing MSE | Primary Error Source | Model Status |
|---|---|---|---|---|
| Degree 1 | 0.2929 [15] | High | Bias | Underfitting |
| Degree 4 | 0.0714 [15] | Lower | Balanced | Optimal Range |
| Degree 18 | ~0.01 [18] | ~0.014 [18] | Balanced | Near Optimal |
| Degree 25 | ~0.059 [15] | Higher | Variance | Overfitting |
| Degree 40 | ~0.01 [18] | 315 [18] | Variance | Severe Overfitting |
The extreme performance degradation at degree 40 (testing MSE of 315 compared to training MSE of 0.01) exemplifies the critical risk of overfitting in complex models and underscores the importance of rigorous validation [18].
Experimental Protocols
Protocol 1: Bias-Variance Decomposition Analysis
Objective: Quantitatively decompose model error into bias and variance components to diagnose performance limitations.
Materials:
- Dataset with ground truth labels
- Computational environment (Python/R)
- Model family with tunable complexity (e.g., polynomial regression, decision trees)
Procedure:
- Data Preparation:
- Generate or select a dataset with known underlying function (e.g., sinusoidal pattern)
- Add controlled Gaussian noise (μ=0, σ=0.1) to simulate real-world variability [18]
- Split data into training, validation, and testing sets (typical ratio: 60/20/20)
Model Training:
- Train multiple models across complexity spectrum (e.g., polynomial degrees 1-40)
- For each complexity level, train multiple instances on different data samples using bootstrapping
Error Calculation:
- Calculate predictions for each model on fixed test points
- Compute bias² as squared difference between average prediction and true value
- Compute variance as average squared difference between individual predictions and average prediction
- Sum components to obtain total error
Analysis:
- Identify complexity level where total error is minimized
- Determine whether bias or variance dominates at current model configuration
- Select optimal model complexity for deployment
Expected Outcomes: A U-shaped error curve demonstrating the tradeoff, with clear identification of the optimal operating point for the given dataset.
Protocol 2: Regularization Optimization Framework
Objective: Identify optimal regularization parameters to control overfitting while maintaining model capacity.
Materials:
- High-dimensional dataset (common in omics studies)
- Regularized model algorithm (Lasso, Ridge, Elastic Net)
- Cross-validation framework
Procedure:
- Experimental Setup:
- Standardize features to zero mean and unit variance to ensure penalty uniformity
- Define regularization parameter grid (λ range from 10^-5 to 10^5 in logarithmic steps)
Model Selection:
- Implement k-fold cross-validation (k=5 or 10) for each λ value
- For L1/L2 regularization, monitor coefficient paths as λ increases
- For Elastic Net, optimize both λ and α mixing parameters
Convergence Detection:
- Monitor learning curves (training/validation error vs. sample size)
- Identify convergence point where additional data provides diminishing returns [19]
- Establish minimum sufficient dataset size for future experiments
Validation:
- Evaluate selected model on held-out test set
- Compare performance metrics with unregularized baseline
- Assess feature selection stability (for L1 regularization)
Expected Outcomes: A regularized model with improved generalization performance, optimal feature subset, and quantitative assessment of bias-variance balance.
Research Reagent Solutions
Table 3: Essential Methodological Tools for Bias-Variance Optimization
| Research Tool | Function | Application Context |
|---|---|---|
| k-Fold Cross-Validation | Robust error estimation | Model selection & hyperparameter tuning across all research domains |
| L2 (Ridge) Regularization | Prevents coefficient inflation | Continuous outcomes, multicollinear predictors (transcriptomic data) |
| L1 (Lasso) Regularization | Automatic feature selection | High-dimensional data with sparse signal (genomic marker identification) |
| Elastic Net | Hybrid feature selection & regularization | When predictors are highly correlated and sparse solutions desired |
| Learning Curves | Diagnostic for data adequacy | Determining whether more data will improve performance |
| Bootstrap Aggregation (Bagging) | Variance reduction through averaging | Unstable estimators (decision trees) in compound activity prediction |
| Boosting Methods | Sequential bias reduction | Improving weak predictors for accurate ensemble models |
Visualization Framework
Model Selection Workflow
The following diagram outlines a systematic approach for model optimization within the bias-variance framework, particularly relevant for drug development applications:
Implementation Considerations for Scientific Research
When applying these principles in drug development and scientific research, several domain-specific considerations enhance practical utility:
- Data Heterogeneity: Biological datasets often exhibit substantial heterogeneity; stratified sampling during cross-validation ensures representative error estimation
- Feature Interpretation: In addition to predictive performance, prioritize model interpretability for biological insight generation
- Multi-scale Validation: Implement validation at molecular, cellular, and organismal levels where applicable to ensure robust generalizability
- Regulatory Compliance: Document all model selection decisions and parameter choices for regulatory submission requirements
The bias-variance tradeoff provides a principled framework for developing models that generalize effectively beyond their training data—a critical consideration in scientific research and drug development. Through systematic application of the experimental protocols and visualization tools presented, researchers can quantitatively diagnose model deficiencies, implement appropriate regularization strategies, and optimize the balance between underfitting and overfitting. This approach ensures that predictive models capture genuine biological signals rather than experimental noise, ultimately enhancing the reliability and translational impact of computational approaches in pharmaceutical research.
Within the framework of a thesis investigating regularization techniques to prevent overfitting in biomedical research, it is critical to first understand the fundamental data-driven challenges that necessitate such interventions. Overfitting is a pervasive modeling error where a machine learning algorithm captures noise or random fluctuations in the training data rather than the underlying pattern, leading to excellent performance on training data but poor generalization to unseen data [20]. In biomedical applications—spanning clinical proteomics, immunology, medical imaging, and precision oncology—the consequences of overfitting are particularly severe, as they can lead to erroneous biomarker discovery, inaccurate diagnostic tools, and unreliable clinical decision support systems [21] [22] [23].
This application note details the three most common and interconnected catalysts for overfitting in biomedical data analysis: small sample sizes, high-dimensional omics data, and redundant features. We will dissect each cause, present quantitative evidence of their impact, provide detailed experimental protocols for mitigation grounded in regularization principles, and outline essential tools for the research practitioner.
Core Causes of Overfitting: Analysis and Quantitative Evidence
Small Sample Sizes
The high cost, ethical constraints, and technical difficulty of collecting and labeling biomedical data often result in limited training samples [24]. This data scarcity is a primary driver of overfitting, as models with sufficient complexity can easily memorize the small dataset, including its noise, rather than learning generalizable patterns [25]. In clinical proteomics and intensive care unit (ICU) studies, datasets frequently comprise fewer than 1,000 patients, which tends to overestimate performance without rigorous external validation [21] [23].
Quantitative Impact: A study on physiological time series classification demonstrated that deep learning models trained on limited samples suffer from severe overfitting and reduced generalization ability. The proposed WEFormer model, which incorporates regularization via a frozen pre-trained time-series foundation model and wavelet decomposition, achieved significant performance gains precisely because it was designed for small sample size scenarios [24].
Table 1: Impact of Small Sample Sizes on Model Performance
| Dataset/Context | Typical Sample Size | Reported Consequence | Mitigation Strategy |
|---|---|---|---|
| ICU Risk Prediction [23] | Often < 1,000 patients | Overestimation of performance, poor external generalization | External validation, data augmentation |
| Physiological Time Series [24] | Limited, costly to obtain | Severe overfitting in deep learning models | Use of frozen foundation models (transfer learning), wavelet decomposition |
| Clinical Proteomics [21] | Small cohorts relative to feature number | Limited real-world impact, poor generalization | Emphasis on rigorous study design, simplicity, and validation |
High-Dimensional Omics Data
The advent of high-throughput technologies generates datasets where the number of features (e.g., genes, proteins, metabolites) p vastly exceeds the number of samples n. This "curse of dimensionality" creates a vast model space where finding a truly predictive signal is extremely difficult, and the risk of fitting to spurious correlations is high [26]. In precision oncology, integrating multi-omics data (genome, transcriptome, proteome) is essential but compounds this dimensionality problem [27].
Quantitative Impact: Research on feature selection in healthcare datasets shows that high dimensionality presents major challenges for analysis and interpretation. An ensemble feature selection strategy achieved over a 50% reduction in feature subset size while maintaining or improving classification metrics like the F1 score by up to 10% [28]. This direct link between dimensionality reduction and performance maintenance underscores the overfitting risk inherent in high-dimensional data.
Redundant and Noisy Features
Biomedical datasets frequently contain irrelevant, redundant, or highly correlated features (e.g., technical noise from different scanner types, batch effects, or biologically correlated analytes) [25]. These features add no informative value for the prediction task but increase model complexity, allowing the algorithm to fit to irrelevant noise. For instance, a tumor detection model trained on MRI scans from one manufacturer may overfit to scanner-specific artifacts and fail on data from another manufacturer [25].
Quantitative Impact: The double-edged nature of model complexity is clear: adding more features reduces training error but can increase model variance, leading to higher test error [22]. Regularization techniques like Lasso (l1), which penalize the absolute values of coefficients, can drive coefficients of irrelevant features to zero, effectively performing feature selection and combating this cause of overfitting [22].
Table 2: Comparative Analysis of Causes and Regularization-Based Solutions
| Cause of Overfitting | Primary Effect | Exemplary Regularization/Prevention Technique | Expected Outcome |
|---|---|---|---|
| Small Sample Size | High variance, model memorization | Early Stopping [22] [25]; Use of Pre-trained/Frozen Foundation Models [24] | Halts training before noise fitting; leverages external knowledge to reduce trainable parameters. |
| High Dimensionality | Vast model space, spurious correlations | Dimensionality Reduction (PCA, Feature Selection) [22]; l1/Lasso Regularization [22] |
Reduces feature space; enforces sparsity in model coefficients. |
| Redundant/Noisy Features | Increased complexity, fitting to artifacts | Ensemble Feature Selection [28]; l2/Ridge Regularization [22] |
Identifies clinically relevant features; shrinks coefficients of correlated features. |
Detailed Experimental Protocols
Protocol 1: Implementing Ensemble Feature Selection for High-Dimensional Healthcare Data
Based on the method from [28]
Objective: To reduce dimensionality and mitigate overfitting by identifying a robust, clinically relevant feature subset from multi-modal biomedical data.
Materials:
- High-dimensional dataset (e.g., BioVRSea, SinPain [28]).
- Python/R environment with scikit-learn.
- Tree-based models (Random Forest, XGBoost) for initial ranking.
- Greedy backward elimination algorithm.
Procedure:
- Feature Ranking: Train a tree-based model (e.g., Random Forest) on the entire training set. Rank all features based on their calculated importance scores (e.g., Gini importance).
- Greedy Backward Elimination: Starting with the full feature set, iteratively remove the least important feature (from the current model) and re-evaluate model performance on a held-out validation set. Use a performance metric (e.g., F1 score) as the criterion.
- Subset Generation: Record the performance curve throughout the elimination process. Generate several candidate feature subsets (e.g., the set at the performance peak, sets within one standard error of the peak).
- Ensemble Merging: Combine the candidate subsets using a union or intersection strategy. The study [28] used a specific merging strategy to produce a single, robust set of features.
- Validation: Train and evaluate a final model (e.g., Support Vector Machine, Random Forest) using only the selected feature subset on an independent test set. Compare accuracy, precision, recall, and F1 score to the model trained on all features.
Diagram: Workflow for Ensemble Feature Selection
Protocol 2: Training a Regularized Model for Small-Sample Physiological Time Series
Based on the WEFormer model from [24]
Objective: To classify physiological time series (e.g., EEG, ECG) using a deep learning model regularized to prevent overfitting on small datasets.
Materials:
- Small-sample physiological dataset (e.g., WESAD, MOCAS [24]).
- Pre-trained Time Series Foundation Model (TSFM), e.g., MOMENT [24], with weights frozen.
- PyTorch/TensorFlow environment.
- Differentiable Wavelet Transform (MODWT) layer.
Procedure:
- Data Preparation: Load raw, multimodal physiological time series signals. Minimal preprocessing is recommended to avoid data leakage.
- Dual-Path Input Processing:
- Path A (Raw Signal): Pass the raw input signal through a learnable wavelet decomposition layer (MODWT). This decomposes the signal into frequency sub-bands.
- Path B (Foundation Features): Pass the same raw input signal through the frozen pre-trained TSFM to extract generalized, high-level features.
- Learnable Attention: Apply a cross-modal attention mechanism (e.g., as in Husformer [24]) to the wavelet sub-bands. This mechanism adaptively learns to highlight frequency bands critical for the task and suppress noisy bands.
- Feature Fusion and Classification: Fuse the attended wavelet features (Path A) with the frozen TSFM embeddings (Path B). Pass the fused representation through a final classifier head (e.g., a fully connected layer).
- Training with Caution: Train only the parameters of the wavelet layer, attention mechanism, and classifier head. Do not fine-tune the frozen TSFM. Use early stopping by monitoring validation loss to halt training before overfitting occurs.
Diagram: WEFormer Architecture for Small Samples
The Scientist's Toolkit: Research Reagent Solutions
Table 3: Essential Tools and Materials for Combating Overfitting
| Tool/Resource | Type | Primary Function in Preventing Overfitting | Example/Source |
|---|---|---|---|
| Pre-trained Foundation Models | Software/Model | Provides strong, generalizable feature priors; reduces trainable parameters for small-sample tasks, acting as a form of implicit regularization. | MOMENT (Time Series) [24], Frozen encoders in Flexynesis [27]. |
| Ensemble Feature Selection Algorithms | Algorithm | Reduces model complexity and variance by systematically identifying and removing redundant/irrelevant features. | Waterfall Selection (Tree Rank + Greedy Elim.) [28], TMGWO, ISSA [26]. |
| Regularization-Enabled Software Frameworks | Software Framework | Simplifies the implementation of l1/l2 penalties, dropout, and early stopping within standard model training workflows. |
Scikit-learn, PyTorch, TensorFlow, Flexynesis [27]. |
| Curated Benchmark Datasets | Data | Enables robust external validation, which is critical for detecting overfitting and assessing true generalizability. | WESAD [24], BioVRSea & SinPain [28], TCGA/CCLE [27]. |
| Hybrid Feature Selectors (TMGWO, BBPSO) | Optimization Algorithm | Intelligently searches high-dimensional feature spaces for optimal, small subsets that maximize model accuracy and generalization. | Two-phase Mutation Grey Wolf Optimizer (TMGWO) [26]. |
| Data Augmentation Pipelines | Data Processing Technique | Artificially increases effective sample size and diversity, diluting the influence of noise and reducing memorization. | Synthetic data generation, signal warping/adding noise for time series [24]. |
| Cross-Validation Schedulers | Evaluation Protocol | Provides a more reliable estimate of model performance on unseen data than a single train-test split, guiding hyperparameter tuning without causing data leakage. | k-Fold, Leave-One-Out Cross-Validation (LOOCV) [26] [25]. |
Application Notes & Protocols
Context within a Thesis on Regularization Techniques: This document serves as a methodological companion to a broader research thesis investigating advanced regularization techniques for mitigating overfitting in predictive models, with a particular focus on applications in computational drug discovery. The reliable detection of overfitting is the critical first step that informs the selection and tuning of subsequent regularization strategies [25] [29].
The primary quantitative evidence for overfitting manifests in the disparity between performance metrics calculated on training versus held-out validation data. The following table synthesizes key metrics and their interpreted meaning from experimental model training [25] [30] [31].
Table 1: Key Quantitative Indicators for Overfitting Detection
| Metric | Typical Calculation | Indicator of Overfitting | Interpretation & Threshold Context |
|---|---|---|---|
| Training-Validation Accuracy Gap | Training_Accuracy - Validation_Accuracy |
A large, persistent gap (e.g., >10-15%) is a strong signal [25] [32]. | Suggests the model memorizes training-specific patterns. The acceptable threshold is domain-dependent but should be minimal. |
| Training-Validation Loss Gap | Validation_Loss - Training_Loss |
Validation loss significantly exceeds training loss. A rising validation loss concurrent with falling training loss is a definitive signature [25] [31]. | The model's errors on new data increase as it fits training noise. The divergence point pinpoints the onset of overfitting. |
| Cross-Validation Performance Variance | Standard deviation of accuracy/loss across k folds. | High variance across folds indicates model performance is unstable and highly dependent on the specific training subset [30] [33]. | Models that generalize poorly will show inconsistent results when validated on different data slices. |
| Learning Curve Divergence | Tracking loss/accuracy vs. epochs or data size. | The validation metric curve plateaus or worsens while the training metric continues to improve [30] [31]. | Visual confirmation that additional training (or complexity) only improves performance on the training set. |
Core Experimental Protocols for Detection
The following protocols detail standardized methodologies for detecting overfitting using the key indicators listed above. These protocols are foundational for empirical validation within regularization research.
Protocol 1: Monitoring Loss Curves for Early Stopping Criterion
Objective: To identify the optimal training epoch where further iteration leads to overfitting, characterized by a rising validation loss. Materials: Model, training dataset (Dtrain), validation dataset (Dval), loss function (L), optimizer. Procedure:
- Initialization: Split the full dataset into Dtrain (e.g., 80%) and Dval (20%). Ensure no data leakage [30].
- Epoch Loop: For each training epoch (e): a. Train the model on Dtrain for one full pass. b. Compute the training loss (Ltrain(e)) as the average loss over all batches in Dtrain [31]. c. Evaluate the model on the untouched Dval to compute validation loss (Lval(e)). d. Record Ltrain(e) and L_val(e).
- Analysis & Stopping Point: a. Plot Ltrain and Lval against epoch count. b. Identify epoch (e) where L_val is at its minimum and begins to increase subsequently, while L_train continues to decrease. c. The point (e) is the early stopping trigger. Training beyond e* constitutes overfitting [29] [32]. Expected Outcome: A plot demonstrating the characteristic divergence, providing empirical justification for applying early stopping as a regularization technique.
Protocol 2: K-Fold Cross-Validation for Robust Generalization Assessment
Objective: To obtain a robust estimate of model generalization error and detect overfitting by testing on multiple, distinct validation folds. Materials: Full dataset (D), model architecture, k parameter (typically 5 or 10). Procedure:
- Partitioning: Randomly shuffle D and partition it into k mutually exclusive subsets (folds) of approximately equal size.
- Iterative Training & Validation: For i = 1 to k: a. Designate fold i as the validation set (Dvali). b. Use the remaining k-1 folds as the training set (Dtraini). c. Train a new model instance from scratch on Dtraini. d. Evaluate the model on Dvali, recording primary metrics (e.g., accuracy, loss).
- Aggregate Analysis: a. Calculate the mean and standard deviation of the validation metric across all k folds. b. Compare to Training Performance: For each fold i, also note the final performance on Dtraini. A consistent pattern where mean(Dtrainmetrics) >> mean(Dvalmetrics) confirms overfitting [25] [34]. c. High standard deviation in D_val metrics further indicates model instability and sensitivity to data sampling—a hallmark of high variance/overfitting [33]. Expected Outcome: A k-fold CV report table showing performance per fold. Overfitting is indicated by high average training performance coupled with lower average validation performance and/or high validation metric variance.
Visualization of Detection Logic & Workflows
Diagram 1: Early Stopping Workflow Logic (93 chars)
Diagram 2: Bias-Variance Tradeoff & Overfitting (99 chars)
The Scientist's Toolkit: Research Reagent Solutions
Essential computational tools and conceptual "reagents" for conducting overfitting detection experiments, analogous to a wet-lab protocol.
Table 2: Essential Toolkit for Overfitting Detection Research
| Tool/Reagent | Function in Detection Protocol | Example/Implementation Note |
|---|---|---|
| Validation Set | Provides unbiased evaluation data to compute validation loss/accuracy, the primary indicator for overfitting [25] [32]. | Typically 15-20% of labeled data, held out from training. Must be representative and free from leakage. |
| K-Fold Cross-Validation Scheduler | Automates the partitioning and iterative training-validation process for robust generalization error estimation [30] [34]. | sklearn.model_selection.KFold or custom training loops. |
| Loss Function & Metric Trackers | Quantifies the error (loss) and performance (accuracy, etc.) on training and validation sets across epochs [31]. | Cross-entropy (classification), MSE (regression). Track with TensorBoard, MLflow, or custom loggers. |
| Learning Curve Plotter | Visualizes the divergence between training and validation metrics, offering intuitive detection of overfitting onset [30] [31]. | Matplotlib, Seaborn scripts to plot loss/accuracy vs. epochs. |
| Regularization Probes (L1/L2, Dropout) | Used in controlled experiments to test if performance gap shrinks. Applying regularization and observing a reduced gap confirms initial overfitting [29] [35]. | L1/L2 penalty in optimizers, Dropout layers in neural networks. Compare validation performance with/without. |
| Data Augmentation Module | Generates modified training samples. If performance improves on validation set, it suggests the model was previously overfitting to limited data variations [25] [34]. | Image transforms (flips, rotations), noise injection, SMILES enumeration for molecular data. |
A Practical Guide to Regularization Methods for Robust Drug Discovery Models
L1 (Lasso) Regularization for Feature Selection in High-Dimensional Biomarker Data
In the field of biomedical research, the advent of high-throughput technologies has enabled the collection of vast amounts of molecular data, creating landscapes of high-dimensional biomarker information. In such contexts, where the number of features (p) often far exceeds the number of observations (n), traditional statistical models face significant challenges, including severe overfitting. Overfitting occurs when a model learns not only the underlying patterns in the training data but also the noise and random fluctuations, resulting in poor generalization to new, unseen data [36]. This problem is particularly pronounced in high-dimensional spaces where data points become sparse and models can easily identify false relationships between variables [36]. Regularization techniques represent a powerful solution to this problem by introducing constraints or penalties to the model to prevent overfitting and improve generalization [37].
Among regularization methods, L1 regularization, commonly known as LASSO (Least Absolute Shrinkage and Selection Operator), has emerged as a particularly valuable tool for high-dimensional biomarker data. Unlike its counterpart L2 regularization (Ridge), which only shrinks coefficients toward zero, L1 regularization has the unique property of performing feature selection by driving some coefficients to exactly zero [37]. This characteristic is exceptionally beneficial in biomarker discovery, where the primary goal is often to identify a minimal set of molecular features—such as genes, proteins, or metabolites—that are most predictive of clinical outcomes. By automatically selecting a sparse subset of relevant features, LASSO helps create more interpretable models that are less prone to overfitting, which is crucial for developing clinically applicable diagnostic and prognostic tools [38] [39] [40].
Theoretical Foundation of L1 Regularization
Mathematical Formulation
The L1 regularization technique operates by adding a penalty term to the standard loss function of a model. This penalty term is proportional to the sum of the absolute values of the model coefficients (L1 norm). For a general linear model, the objective function for LASSO optimization can be represented as:
min (Loss Function + λ × ||β||₁)
Where:
- Loss Function represents the error between predicted and actual values (e.g., residual sum of squares for linear regression, negative log-likelihood for logistic regression)
- λ (lambda) is the regularization parameter that controls the strength of the penalty
- β represents the vector of model coefficients
- ||β||₁ is the L1 norm of the coefficient vector, calculated as the sum of absolute values of all coefficients
The regularization parameter λ plays a critical role in determining the balance between model fit and complexity. When λ = 0, the model equivalent to an unregularized model, which may overfit the training data. As λ increases, the penalty term exerts more influence, forcing more coefficients toward zero and resulting in a sparser model [37]. The optimal value of λ is typically determined through cross-validation techniques, which provide a robust assessment of model performance on unseen data [38] [37].
Comparative Analysis of Regularization Techniques
The following table compares L1 regularization with other common regularization approaches:
Table 1: Comparison of Regularization Techniques for High-Dimensional Data
| Technique | Penalty Term | Effect on Coefficients | Feature Selection | Best Use Cases |
|---|---|---|---|---|
| L1 (LASSO) | λ × ‖β‖₁ | Shrinks coefficients to exactly zero | Yes | Sparse models, biomarker identification, when only few features are relevant |
| L2 (Ridge) | λ × ‖β‖₂² | Shrinks coefficients uniformly but not to zero | No | All features contribute, correlated features, when no feature elimination is desired |
| Elastic Net | λ₁ × ‖β‖₁ + λ₂ × ‖β‖₂² | Balances between L1 and L2 effects | Yes, but less aggressive than L1 | Highly correlated features, grouped feature selection |
The feature selection capability of L1 regularization makes it particularly suitable for biomarker discovery, where researchers often work under the assumption that only a small subset of measured molecular features has true biological relevance to the disease or condition under investigation [38] [39] [40]. By zeroing out irrelevant features, LASSO automatically performs feature selection during the model fitting process, yielding more interpretable models that are less likely to overfit to noise in the data.
Advanced L1 Regularization Strategies for Biomarker Data
SMAGS-LASSO for Sensitivity-Specificity Optimization
In clinical diagnostics, particularly for diseases with low prevalence such as cancer, standard machine learning approaches that prioritize overall accuracy may fail to align with clinical priorities. To address this challenge, researchers have developed SMAGS-LASSO (Sensitivity Maximization at a Given Specificity), which combines a custom sensitivity-maximizing loss function with L1 regularization [38]. This approach specifically addresses the need for high sensitivity in early cancer detection while maintaining high specificity to avoid unnecessary clinical procedures in healthy individuals.
The SMAGS-LASSO objective function is formulated as:
maxβ,β₀ ∑i=1n ŷi · yi / ∑i=1n yi - λ‖β‖₁
Subject to: (1 - y)ᵀ(1 - ŷ) / (1 - y)ᵀ(1 - y) ≥ SP
Where SP is the user-defined specificity threshold, and ŷi is the predicted class for observation i, determined by ŷi = I(σ(xiᵀβ + β₀) > θ), with θ being a threshold parameter adaptively determined to control specificity [38].
In synthetic datasets designed with strong sensitivity and specificity signals, SMAGS-LASSO demonstrated remarkable performance, achieving sensitivity of 1.00 compared to just 0.19 for standard LASSO at 99.9% specificity [38]. When applied to colorectal cancer biomarker data, SMAGS-LASSO showed a 21.8% improvement over standard LASSO and a 38.5% improvement over Random Forest at 98.5% specificity while selecting the same number of biomarkers [38].
Tissue-Guided LASSO for Contextual Biomarker Selection
The tissue of origin plays a critical role in cancer biology and treatment response, yet standard machine learning approaches often overlook this important contextual information. Tissue-Guided LASSO (TG-LASSO) was developed to explicitly integrate information on samples' tissue of origin with gene expression profiles to improve prediction of clinical drug response [40].
TG-LASSO addresses the fundamental challenge of predicting clinical drug response using preclinical cancer cell line data by incorporating tissue-specific constraints into the regularization process. This approach recognizes that biomarkers for drug sensitivity may vary across different tissue types, even when examining the same therapeutic compound [40].
In comprehensive evaluations using data from the Genomics of Drug Sensitivity in Cancer (GDSC) database and The Cancer Genome Atlas (TCGA), TG-LASSO outperformed various linear and non-linear algorithms, successfully distinguishing resistant and sensitive patients for 7 out of 13 drugs tested [40]. Furthermore, genes identified by TG-LASSO as biomarkers for drug response were significantly associated with patient survival, underscoring their clinical relevance [40].
Bayesian Two-Step LASSO for Prognostic and Predictive Biomarkers
In targeted therapy development, accurately identifying biomarkers that are either prognostic (associated with disease outcome regardless of treatment) or predictive (associated with differential treatment effects) represents a critical challenge. The Bayesian Two-Step Lasso strategy addresses this challenge through a sequential approach to biomarker selection [39].
The methodology employs:
- Step 1: Bayesian group Lasso to identify biomarker groups containing main effects and treatment interactions, applying loose selection criteria to screen out unimportant biomarkers
- Step 2: Bayesian adaptive Lasso for refined variable selection among biomarkers identified in the first step to distinguish prognostic and predictive markers [39]
This approach is particularly valuable in clinical trial settings for targeted therapy development, where accurately identifying biomarkers that can guide treatment assignment is essential for personalized medicine approaches. The Bayesian framework provides natural uncertainty quantification for the selected biomarkers, which is valuable for clinical decision-making [39].
Experimental Protocols and Implementation
SMAGS-LASSO Implementation Protocol
Objective: Implement SMAGS-LASSO for sensitivity-maximizing biomarker selection with controlled specificity.
Materials and Software Requirements:
- High-dimensional biomarker dataset with binary clinical outcomes
- Python programming environment with NumPy, SciPy, and scikit-learn libraries
- Computational resources capable of parallel processing
Procedure:
- Data Preprocessing:
- Standardize features to have zero mean and unit variance
- Perform 80/20 stratified train-test split to maintain class balance
Parameter Initialization:
- Initialize coefficients using standard logistic regression
- Define λ sequence from λmax (all coefficients zero) to λmin (minimal regularization)
- Set target specificity threshold SP based on clinical requirements
Multi-Algorithm Optimization:
- Execute parallel optimization using Nelder-Mead, BFGS, CG, and L-BFGS-B algorithms
- Apply tolerance levels from 1e-5 to 1e-8 for each algorithm
- Select model with highest sensitivity among converged solutions
Cross-Validation:
- Implement 5-fold cross-validation
- For each λ, calculate sensitivity MSE: MSE_sensitivity = [1 - (∑ŷᵢ·yᵢ / ∑yᵢ)]²
- Compute norm ratio ‖β_λ‖₁ / ‖β‖₁ to quantify sparsity
- Select λ that minimizes sensitivity MSE while maintaining specificity constraint
Feature Selection:
- Retain features with absolute coefficient values exceeding 5% of the largest coefficient's absolute value
- Validate selected features on held-out test set
Troubleshooting Tips:
- For non-convergence, increase number of parallel optimizations or adjust tolerance levels
- If specificity constraint is violated, increase SP parameter or adjust threshold θ
- For unstable feature selection, implement bootstrap aggregation of SMAGS-LASSO models
Tissue-Guided LASSO Experimental Protocol
Objective: Predict clinical drug response using preclinical cancer cell line data with tissue-specific regularization.
Data Requirements:
- Gene expression profiles and drug response data from GDSC database
- Gene expression profiles and clinical drug response from TCGA
- Tissue type annotations for all samples
Methodology:
- Data Harmonization:
- Match gene expression features between GDSC and TCGA datasets
- Align drug response measures (e.g., IC50 for GDSC, clinical response for TCGA)
- Annotate samples by tissue of origin
TG-LASSO Implementation:
- Implement tissue-specific penalty parameters λ_t for each tissue type t
- Optimize objective function: min‖Y - Xβ‖₂² + ∑t λt ‖β_t‖₁
- Where β_t represents coefficients for tissue type t
Model Validation:
- Train on entire GDSC dataset with tissue-specific constraints
- Validate on TCGA data using tissue-stratified performance metrics
- Assess ability to distinguish resistant vs. sensitive patients via ROC analysis
Biomarker Identification:
- Extract non-zero coefficients for each tissue-drug combination
- Perform pathway enrichment analysis on selected genes
- Validate biological relevance through literature mining and survival analysis
Validation Metrics:
- Area under ROC curve (AUC) for patient stratification
- Statistical significance of survival differences between predicted sensitive and resistant groups
- Enrichment of known drug targets in selected biomarkers
Research Reagent Solutions
Table 2: Essential Research Reagents and Computational Tools for Biomarker Discovery Using L1 Regularization
| Reagent/Resource | Function | Application Context |
|---|---|---|
| GDSC Database | Provides gene expression and drug sensitivity data for cancer cell lines | Training dataset for preclinical-to-clinical prediction models [40] |
| TCGA Data Portal | Offers molecular profiles and clinical data for patient tumors | Validation dataset for clinical relevance of identified biomarkers [40] |
| Bayesian Lasso Software | Implements Bayesian versions of Lasso with uncertainty quantification | Probabilistic biomarker selection for targeted therapy development [39] |
| mindLAMP Platform | Collects and visualizes digital biomarker data from smartphone sensors | Visualization and interpretation of digital biomarkers for clinical communication [41] |
| Cross-Validation Framework | Assesses model performance and selects regularization parameters | Preventing overfitting and ensuring robust biomarker selection [38] [36] |
Workflow and Conceptual Diagrams
SMAGS-LASSO Optimization Workflow
Tissue-Guided LASSO Conceptual Framework
High-Dimensional Data Challenge and Regularization Solution
L1 regularization represents a powerful approach for feature selection in high-dimensional biomarker data, directly addressing the challenge of overfitting that plagues traditional statistical methods in high-dimensional settings [36] [37]. The fundamental capability of LASSO to perform automatic feature selection while maintaining model performance makes it particularly valuable for biomarker discovery, where identifying minimal feature sets with maximal predictive power is often a primary objective.
Advanced variants of LASSO, including SMAGS-LASSO, Tissue-Guided LASSO, and Bayesian Two-Step Lasso, demonstrate how domain-specific adaptations can enhance the basic methodology to address specific challenges in clinical translation [38] [39] [40]. These specialized approaches acknowledge that clinical utility requires not just statistical performance but also alignment with clinical priorities, biological context, and implementation practicalities.
As biomarker data continues to grow in dimensionality and complexity, with emerging data types from digital health technologies and multi-omics platforms, the importance of robust feature selection methodologies will only increase [41]. L1 regularization and its evolving variants provide a foundational framework for extracting clinically meaningful signals from high-dimensional data, ultimately supporting the development of more precise diagnostic, prognostic, and predictive tools in personalized medicine.
Within the broader thesis on regularization techniques for preventing overfitting in predictive research, L2 regularization, or Ridge Regression, occupies a critical position as a stabilizer for models plagued by multicollinearity. Unlike methods that perform feature selection, Ridge regression addresses the instability of coefficient estimates when independent variables are highly correlated, a common scenario in high-dimensional biological and chemical data [42] [43] [44]. This document serves as an Application Note and Protocol, detailing the implementation, rationale, and practical application of Ridge regression, specifically tailored for researchers, scientists, and professionals in drug development where model reliability is paramount.
Mathematical Foundation and Core Mechanism
Ridge regression modifies the ordinary least squares (OLS) objective function by adding a penalty term proportional to the sum of the squared coefficients. This L2 penalty shrinks coefficients towards zero but rarely sets them to exactly zero [43] [44].
Core Objective Function:
The Ridge estimator minimizes the following cost function:
argmin(||y - Xβ||² + λ||β||²)
Where:
yis the vector of observed target values.Xis the matrix of predictor variables.βis the vector of regression coefficients to be estimated.λ(lambda,alphain scikit-learn) is the regularization hyperparameter controlling penalty strength [42] [45].
Closed-Form Solution:
The solution is given by:
β̂_ridge = (XᵀX + λI)⁻¹ Xᵀy
The addition of λI (where I is the identity matrix) ensures the matrix (XᵀX + λI) is always invertible, even when XᵀX is singular due to perfect multicollinearity, thus providing stable coefficient estimates [44] [46].
Bias-Variance Tradeoff:
The introduction of the penalty term intentionally increases model bias (a slight systematic error) to achieve a greater reduction in variance (sensitivity to fluctuations in training data). This tradeoff is central to Ridge's ability to improve generalization to unseen test data [43] [46]. When λ=0, the model reverts to OLS with high variance risk. As λ → ∞, coefficients shrink excessively toward zero, leading to high bias and underfitting [42].
Comparative Analysis of Regularization Techniques
Ridge regression is one of several regularization methods. Its properties are best understood in contrast to alternatives like Lasso (L1) and Elastic Net.
Table 1: Comparison of Common Regularization Techniques for Linear Regression
| Technique | Penalty Term | Effect on Coefficients | Key Strength | Best Use Case |
|---|---|---|---|---|
| Ridge (L2) | λ∑βᵢ² | Shrinks all coefficients proportionally; rarely sets any to zero. | Stabilizes estimates, handles multicollinearity well. | All predictors are relevant; primary issue is correlated features. |
| Lasso (L1) | λ∑|βᵢ| | Can shrink coefficients to exactly zero, performing automatic feature selection. | Creates sparse, interpretable models. | Suspected many irrelevant features; goal is variable selection. |
| Elastic Net | λ₁∑|βᵢ| + λ₂∑βᵢ² | Hybrid: can both select variables and shrink coefficients. | Balances Ridge and Lasso; good for high-dimensional data with correlated features. | Situations with many correlated predictors where some selection is also desired. [42] [43] [46] |
Application Protocols and Implementation
General Protocol for Ridge Regression Modeling
Objective: To construct a stable linear regression model in the presence of correlated predictors. Workflow: The following diagram outlines the standardized protocol.
Detailed Methodology:
- Data Preprocessing: Scale or standardize features so that the L2 penalty is applied uniformly [46]. Remove outliers that could disproportionately influence the model; for example, the Isolation Forest algorithm was used to remove 973 outlier points in a pharmaceutical study [47].
- Hyperparameter Tuning (λ/α Selection): Use k-fold cross-validation on the training set to evaluate a range of
αvalues. The optimalαis typically the one that minimizes the cross-validated Mean Squared Error (MSE) or maximizes R², balancing bias and variance [43] [46]. - Model Training: Fit the Ridge regression model using the optimal
α. In Python's scikit-learn, theRidgeorRidgeCVclasses are used [42] [45]. - Evaluation: Assess the final model on a completely held-out test set using metrics like R², Root Mean Squared Error (RMSE), and Mean Absolute Error (MAE) [47].
Protocol: Application in Pharmaceutical Drying Process Modeling
This protocol is adapted from a study predicting chemical concentration distribution during lyophilization [47].
Objective: To predict concentration (C in mol/m³) at spatial coordinates (X, Y, Z) using Ridge Regression as one of several benchmark models.
Dataset: Over 46,000 data points generated from numerical simulation of mass transfer equations.
Preprocessing Protocol:
- Outlier Removal: Apply the Isolation Forest (IF) algorithm, an unsupervised ensemble method, with a contamination parameter of 0.02 to identify and remove anomalous data points [47].
- Normalization: Use Min-Max scaling to normalize all feature values to a common range (e.g., [0,1]).
- Data Splitting: Randomly split the processed data into training (~80%) and testing (~20%) sets. Modeling Protocol:
- Hyperparameter Optimization: Utilize an advanced optimization algorithm (e.g., Dragonfly Algorithm) to tune the Ridge regression hyperparameter (
α), with the objective of maximizing the mean 5-fold cross-validated R² score to enhance generalizability [47]. - Training & Benchmarking: Train the optimized Ridge model and compare its performance against other models like Support Vector Regression (SVR) and Decision Trees on the test set.
The Scientist's Computational Toolkit
| Research Reagent (Tool/Algorithm) | Function in Protocol | Key Property / Purpose |
|---|---|---|
Scikit-learn Ridge / RidgeCV |
Core model implementation and hyperparameter tuning. | Provides efficient, numerically stable solvers (e.g., 'svd', 'cholesky', 'sag') for fitting the Ridge model [45]. |
| Isolation Forest Algorithm | Data preprocessing for outlier detection. | Unsupervised method efficient for identifying anomalies in high-dimensional data without needing labeled outliers [47]. |
| Dragonfly Algorithm (DA) | Hyperparameter optimization metaheuristic. | Used to find the optimal regularization parameter (α) by maximizing cross-validated model generalizability [47]. |
| Min-Max Scaler | Feature normalization preprocessing step. | Ensures all input features contribute equally to the L2 penalty term by scaling them to a fixed range [47]. |
| Cross-Validation (k-Fold) | Model validation and hyperparameter selection. | Robust method for estimating model performance and tuning α without leaking test set information [46]. |
Experimental Data & Results in Pharmaceutical Research Context
The utility of Ridge regression is demonstrated in computational biology and drug discovery, where datasets often have many correlated predictors (e.g., molecular descriptors) and a relatively small sample size [43] [48].
Table 2: Performance Comparison in Pharmaceutical Drying Study [47]
| Machine Learning Model | Optimization Method | Test R² Score | Root Mean Squared Error (RMSE) | Key Interpretation |
|---|---|---|---|---|
| Support Vector Regression (SVR) | Dragonfly Algorithm (DA) | 0.999234 | 1.2619E-03 | Best performance; excellent generalization from train (R²=0.999187). |
| Decision Tree (DT) | Dragonfly Algorithm (DA) | (Reported lower than SVR/RR) | (Reported higher than SVR) | Likely prone to overfitting despite optimization. |
| Ridge Regression (RR) | Dragonfly Algorithm (DA) | (Reported, outperformed DT) | (Reported) | Served as a stable, regularized linear benchmark; outperformed DT but was surpassed by the non-linear SVR model. |
Interpretation: While the study found SVR to be superior for the specific non-linear problem, Ridge Regression provided a crucial, stable baseline. Its performance, enhanced by DA optimization, underscores its value as a reliable method when model interpretability and stability are prioritized over maximum predictive power in complex, correlated data environments common in pharmaceutical research [47] [49].
In the field of omics research, including genomics, transcriptomics, and proteomics, the fundamental challenge is the "large p, small n" problem, where the number of predictors (p, e.g., genes, proteins) vastly exceeds the number of observations (n, e.g., patient samples) [50] [51]. This high-dimensional data landscape creates significant risks of overfitting, where models memorize noise and technical artifacts rather than capturing biologically meaningful signals [52]. Regularization techniques have emerged as essential statistical tools to address this challenge by constraining model complexity and promoting generalizability [53] [54].
Elastic Net regularization represents an advanced hybrid approach that synergistically combines the L1 (Lasso) and L2 (Ridge) penalty terms [55]. This combination addresses critical limitations of using either regularizer alone when analyzing omics data, where correlated biomarkers frequently occur in biological pathways [51] [52]. For instance, in transcriptomic analyses, genes operating in coordinated pathways often exhibit high correlation, presenting challenges for variable selection methods that might arbitrarily choose one representative from a functionally related group [50] [51].
The mathematical formulation of Elastic Net incorporates both L1 and L2 regularization through a weighted sum of their penalty terms, controlled by the mixing parameter α (alpha) and overall regularization strength λ (lambda) [56] [55]. This combined approach enables the model to maintain the sparsity-inducing properties of Lasso (effective for feature selection) while retaining the group-handling capabilities of Ridge (effective for correlated variables) [55] [52]. The resulting models demonstrate enhanced stability and predictive performance across diverse omics applications, from immune cell classification using RNA-seq data to disease outcome prediction from multi-omics platforms [50] [51].
Theoretical Foundation and Algorithmic Specifications
Mathematical Formulation
The Elastic Net penalty is defined through a linear combination of the L1 and L2 regularization terms, added to the conventional loss function. For a generalized linear model, the objective function to minimize becomes:
Loss = Losscomponent + λ × [ α × ‖β‖1 + (1 - α) × ‖β‖2 ]
Where:
- Losscomponent represents the conventional loss (e.g., squared error for regression, logistic loss for classification)
- ‖β‖1 = Σ|βj| is the L1 norm (sum of absolute coefficients)
- ‖β‖2 = Σβj2 is the L2 norm (sum of squared coefficients)
- λ ≥ 0 controls the overall regularization strength
- α ∈ [0,1] determines the mixing ratio between L1 and L2 penalties [56] [55] [52]
Table 1: Comparison of Regularization Techniques in High-Dimensional Omics Data
| Feature | L1 (Lasso) | L2 (Ridge) | Elastic Net |
|---|---|---|---|
| Sparsity | Produces sparse models (some coefficients exactly zero) | Shrinks coefficients but rarely sets them to zero | Balanced sparsity through mixed penalties |
| Handling Correlated Features | Selects one from correlated group, ignores others | Distributes weight among correlated features | Maintains groups of correlated features |
| Feature Selection | Built-in feature selection | No inherent feature selection | Grouping effect with selective capability |
| Computational Efficiency | Efficient for high-dimensional data | Highly efficient | Moderately efficient |
| Stability | Unstable with correlated variables | High stability | Improved stability over Lasso |
Optimization and Parameter Interpretation
The Elastic Net optimization problem maintains strong convexity, ensuring a unique minimum—a critical property that distinguishes it from non-convex regularization approaches [57]. The hybrid penalty function enables Elastic Net to overcome the limitation of Lasso, which can select at most n variables when p > n, making it particularly suitable for omics studies where the number of biomarkers frequently exceeds sample size by orders of magnitude [55].
The α parameter provides continuous interpolation between pure Lasso (α = 1) and pure Ridge (α = 0) [56] [52]. This flexibility allows researchers to tailor the regularization strategy to specific data characteristics and analytical goals. For instance, when analyzing gene expression data with expected high correlation within functional pathways, setting α around 0.5 distributes the regularization effect to maintain biologically relevant groupings while still enforcing selective sparsity [51].
Experimental Protocols and Implementation
Protocol: Multi-Omics Classification Using Priority-Elastic Net
The following protocol adapts and extends the Priority-Elastic Net approach for multi-omics data integration, suitable for disease classification or outcome prediction [51]:
Step 1: Data Preprocessing and Block Definition
- Normalize each omics data block separately (e.g., transcriptomics, proteomics, clinical variables) using platform-specific methods
- For RNA-seq data: apply TPM normalization followed by log2 transformation
- Define priority order for data blocks based on biological knowledge or cost considerations (e.g., clinical variables → proteomics → transcriptomics)
- Perform quality control to remove uninformative features with near-zero variance
Step 2: Priority-Based Sequential Modeling
- Fit an Elastic Net model to the highest priority block using cross-validation
- Calculate the linear predictor (Xβ) from the fitted model
- Use this linear predictor as an offset in the Elastic Net model for the next priority block
- Iterate through all data blocks sequentially, propagating offsets from higher to lower priority blocks
- The final model incorporates contributions from all data blocks according to the specified hierarchy
Step 3: Parameter Tuning via Cross-Validation
- Perform nested k-fold cross-validation (e.g., 10-fold) to optimize λ and α parameters
- For each α in [0, 0.1, 0.2, ..., 1.0], identify the optimal λ value minimizing cross-validation error
- Select the (α, λ) combination that minimizes the cross-validated error rate or deviance
- Validate stability through repeated cross-validation or bootstrap procedures
Step 4: Model Validation and Interpretation
- Apply the fitted model to independent validation datasets
- Generate ROC curves and calculate AUC to assess classification performance
- Extract and examine selected features from each data block for biological interpretation
- Perform pathway enrichment analysis on selected genes/proteins to identify functionally coherent patterns
Protocol: Immune Cell Type Classification from Transcriptomic Data
This protocol implements an elastic-net logistic regression approach for immune cell classification using RNA-seq data, based on methodology validated in single-cell studies [50]:
Step 1: Data Preprocessing and Feature Filtering
- Normalize raw count data using TPM or similar length-aware normalization
- Filter genes with low expression across samples (e.g., >90% samples with TPM < 1)
- Impute missing values with -1 to maintain matrix structure for regularization
- Apply standardization to normalize expression values across genes
Step 2: Multiclass Classification with Regularized Logistic Regression
- Implement one-vs-rest elastic-net logistic regression for multiple cell types
- For K cell types, train K binary classifiers, each distinguishing one cell type from all others
- Use the same λ and α parameters across all binary classifiers for consistency
- For each classifier, select the λ value that maximizes AUC while retaining sufficient features
Step 3: Gene Signature Extraction
- Extract non-zero coefficients from the fitted models to define cell-type-specific gene signatures
- Combine signatures across binary classifiers to create a comprehensive multiclass feature set
- Validate signature specificity through cross-validation on held-out samples
- Compare extracted signatures against established biological markers for validation
Step 4: Application to Single-Cell RNA-seq Data
- Apply the trained classifier to annotate cell types in scRNA-seq datasets
- Use signature scores to quantify cell type proportions in heterogeneous samples
- Validate predictions against known marker genes and cluster annotations
- Perform differential expression analysis between misclassified and correctly classified cells
Table 2: Key Parameters for Elastic Net Implementation in Omics Studies
| Parameter | Recommended Settings | Biological Interpretation | Optimization Method |
|---|---|---|---|
| α (alpha) | 0.1-0.7 for omics data | Balance between sparsity and group selection | Grid search with cross-validation |
| λ (lambda) | Path of 100+ values | Overall regularization strength | k-fold cross-validation (k=5 or 10) |
| Standardization | Always recommended | Ensures comparable feature scales | Required before regularization |
| Cross-Validation | 10-fold repeated 3x | Robust performance estimation | Minimize deviance or misclassification |
| Convergence | ε = 1e-7 | Optimization tolerance | Coordinate descent efficiency |
The Scientist's Toolkit: Research Reagent Solutions
Table 3: Essential Computational Tools for Elastic Net Implementation in Omics Research
| Tool/Software | Application Context | Key Functionality | Implementation Example |
|---|---|---|---|
| glmnet (R) | Generalized linear models with elastic net | Efficient coordinate descent algorithm for various families (gaussian, binomial, multinomial) | R: cv.glmnet(x, y, family="binomial", alpha=0.5) [55] |
| Scikit-learn (Python) | Machine learning workflows | ElasticNet and LogisticRegression with elastic net penalty | Python: ElasticNet(alpha=0.1, l1_ratio=0.5) [56] [52] |
| Priority-Elastic Net (R) | Multi-omics data integration | Hierarchical regression with priority order for data blocks | Custom R implementation extending Priority-Lasso [51] |
| SVEN (MATLAB) | Large-scale omics data | Reduction of elastic net to SVM for parallel computing | MATLAB: β = SVEN(X, y, t, λ2) [55] |
| pensim (R) | Parallelized parameter tuning | 2D tuning of λ parameters for improved prediction accuracy | R: pensim() with parallelized cross-validation [55] |
Applications in Omics Research and Validation
Case Study: Immune Cell Classification from RNA-seq Data
In a comprehensive demonstration of Elastic Net application, researchers developed classifiers for ten different immune cell types and five T helper cell subsets using RNA-seq data [50]. The analytical workflow involved training separate elastic-net logistic regression models for each cell type, using a pre-filtering step to select discriminative genes prior to regularization. This approach addressed the high-dimensional challenge where the number of genes (∼20,000) vastly exceeded the number of samples (in the hundreds).
The optimal regularization parameter (λ = 1e-4) was selected to maximize the Area Under the ROC Curve (AUC) while retaining a sufficient number of informative genes (452 genes) for biological interpretation [50]. Validation using independent single-cell RNA-seq datasets confirmed the robustness of the approach, with the classifier successfully annotating previously uncharacterized cell populations. Notably, the method provided biologically interpretable coefficients, where positive weights indicated marker genes specifically expressed in certain cell types (e.g., CYP27B1, INHBA, IDO1 in M1 macrophages), while negative coefficients corresponded to genes absent from particular cell types [50].
Case Study: Multi-Omics Integration for Brain Tumor Classification
The Priority-Elastic Net algorithm has been successfully applied to classify glioma subtypes using multi-omics data from The Cancer Genome Atlas (TCGA) [51]. This approach incorporated a hierarchical structure that prioritized clinical variables, followed by proteomics and transcriptomics data, with each block's fitted values serving as offsets in subsequent modeling stages. The methodology demonstrated superior performance compared to conventional approaches, effectively handling the high correlation structure within and between omics data blocks while maintaining model interpretability.
This implementation highlighted Elastic Net's capability to integrate heterogeneous data types while managing the distinct statistical characteristics of each omics platform. The resulting models provided stable feature selection across data modalities, identifying biomarkers with confirmed biological relevance to glioma pathogenesis and progression [51].
Performance Metrics and Validation Strategies
Robust evaluation of Elastic Net models in omics applications requires specialized metrics that account for class imbalance and high-dimensionality. Beyond conventional accuracy measures, the following performance indicators provide more nuanced assessment:
Classification Performance Metrics:
- Area Under ROC Curve (AUC): Provides comprehensive assessment of classification performance across all decision thresholds [50]
- Balanced Accuracy: Essential for imbalanced datasets where class distribution is unequal [51]
- F-measure: Harmonic mean of precision and recall, suitable for feature selection evaluation
- G-means: Geometric mean of sensitivity and specificity, robust to class imbalance [51]
Stability and Reproducibility Assessment:
- Feature Selection Stability: Measure consistency of selected features across bootstrap samples or data perturbations
- Cross-Validation Concordance: Assess agreement between cross-validation folds in selected features and model performance
- Biological Coherence Evaluation: Validate whether selected gene/protein sets correspond to known pathways or functional groupings
For comprehensive model validation, researchers should employ both internal validation (cross-validation, bootstrap) and external validation (independent datasets, different technological platforms) [50] [51]. Additionally, biological validation through experimental follow-up or comparison with established biological knowledge remains essential for confirming the functional relevance of Elastic Net-derived signatures.
This application note provides a comprehensive protocol for implementing and evaluating advanced regularization techniques designed to mitigate overfitting in Graph Neural Networks (GNNs). Framed within the broader thesis of preventing overfitting in deep learning models, we focus on two pivotal strategies: the evolution of dropout methods adapted for graph-structured data and the emerging paradigm of topology-aware regularization. Targeted at researchers and professionals in computational drug discovery and bioinformatics, this document synthesizes current methodologies, presents quantitative performance comparisons, details experimental protocols, and offers visualization tools to guide robust model development.
Preventing overfitting is a central challenge in training deep neural networks, especially when labeled data is scarce—a common scenario in scientific domains like drug discovery [58]. Regularization techniques modify the learning algorithm to reduce generalization error while balancing training error [59]. While classic methods like L1/L2 regularization and early stopping are foundational [59], the unique structure of graph data, where entities (nodes) are interconnected, demands specialized approaches. GNNs have become dominant for tasks such as molecular property prediction by leveraging message-passing to integrate node features with topological information [60] [61] [62]. However, they remain prone to overfitting on small datasets and to pathologies like over-smoothing, where node representations become indistinguishable with increased network depth [63].
This note details two advanced regularization strands crucial for robust GNNs: (1) Dropout-based Regularization, which has evolved from its standard form in fully-connected networks to graph-specific variants like DropEdge and DropNode [59] [63] [64]; and (2) Topological Regularization, which explicitly utilizes the graph's structural properties—such as homophily, community structure, or specific metrics like Topological Concentration—to guide the learning process and improve generalization [60] [65]. We position these techniques as essential components within a comprehensive regularization framework to enhance model reliability in critical applications.
Core Concepts: From Dropout to Topological Awareness
Evolution of Dropout Regularization for Graphs
The standard dropout method, which randomly omits neurons during training, is a proven regularization technique for preventing co-adaptation of features [59]. Its adaptation for GNNs must account for graph structure:
- DropEdge: Randomly removes a fraction of edges during each training epoch. This not only acts as a regularizer but also directly combats over-smoothing by reducing the speed of neighborhood information mixing [63].
- DropNode: Randomly discards entire nodes and their connections, effectively training on multiple subgraph samples. This can be seen as a graph-level analogue to standard dropout [64].
- Biased DropEdge (BDE): An advanced variant that selectively removes edges between nodes of different classes (inter-class edges). This strategy aims to preserve useful homophilic information while reducing noisy connections that hinder learning, thereby improving the signal-to-noise ratio in message passing [63].
- Locality-aware Feature Dropout: A hardware-informed method that drops node features during aggregation based on DRAM access patterns. While maintaining model accuracy, it significantly improves training efficiency by enhancing data locality [64].
Principles of Topological Regularization
Topological regularization moves beyond random perturbation, using the graph's intrinsic structure as a guide for learning.
- Topology Awareness: Refers to a GNN's ability to exploit the graph's inherent topological properties. Its relationship with generalization performance is complex; while generally beneficial, excessively enhancing it for certain topological features may lead to unfair generalization across different structural groups [60].
- Consistency Regularization based on Augmentation Anchoring (CRGNN): For molecular graphs where strong perturbations may alter fundamental properties, this method uses a weakly-augmented view as an "anchor." A consistency loss encourages the GNN to map strongly-augmented views of a graph close to its anchored representation, enabling safe use of data augmentation for regularization [58].
- Feature and Hyperplane Perturbation: Addresses overfitting caused by sparse initial features (e.g., bag-of-words). It simultaneously perturbs (shifts) the input features and the model's weight matrix (hyperplane), ensuring that gradients flow across all dimensions and preventing overfitting to unrepresented feature dimensions [66].
- Topological Concentration (TC): A node-level metric quantifying the overlap between a node's local subgraph and those of its neighbors. It correlates strongly with link prediction performance and helps identify nodes where GNNs generalize poorly, revealing topological distribution shifts [65].
Experimental Protocols for Evaluation
Protocol 1: Evaluating Dropout Variants on Node Classification
Objective: Compare the efficacy of DropEdge, Biased DropEdge (BDE), and standard dropout in mitigating over-smoothing and overfitting. Datasets: Use benchmark graphs with varying homophily levels (e.g., Cora, Citeseer, PubMed for homophily; Chameleon, Squirrel for heterophily) [63]. Model Architecture: Implement a 4-8 layer GCN or GAT as the base model [63]. Procedure:
- Baseline Training: Train the base model without any dropout.
- Dropout Variant Training: Train identical models, incorporating one technique per experiment:
- Standard Dropout: Apply dropout to the node feature vectors before each graph convolution layer (rate=0.5).
- DropEdge: Randomly drop 10-25% of edges in the adjacency matrix at each training epoch.
- Biased DropEdge (BDE): Estimate class labels for all nodes (e.g., via a shallow model). Drop inter-class edges with a higher probability (e.g., 0.3) than intra-class edges (e.g., 0.05).
- Evaluation: Monitor training/validation loss and accuracy. Report final test accuracy and the rate of performance degradation as model depth increases (over-smoothing measure). Key Metrics: Classification Accuracy, Training/Validation Loss Gap.
Protocol 2: Assessing Topological Regularization for Molecular Property Prediction
Objective: Validate the effectiveness of consistency regularization (CRGNN) on small molecular datasets. Datasets: Use MoleculeNet benchmarks (e.g., BBBP, BACE, ClinTox, Tox21) in data-scarce settings [58] [61]. Model Architecture: Employ a standard Message Passing Neural Network (MPNN) or GIN as the backbone GNN [61]. Procedure:
- Augmentation Strategy:
- Weak Augmentation: Use a minor, property-preserving perturbation (e.g., random atom masking with very low probability or minimal feature noise).
- Strong Augmentation: Apply more aggressive, yet theoretically justified, transformations (e.g., controlled bond deletion or subgraph dropout).
- Training with CRGNN:
- For each molecule in a batch, generate one weak and one strong augmented view.
- The GNN processes both views. The primary loss is the supervised loss (e.g., cross-entropy) computed on the weak view's prediction.
- The consistency regularization loss (e.g., Mean Squared Error) is computed between the latent representations of the strong and weak views.
- The total loss is a weighted sum:
L_total = L_supervised + λ * L_consistency, where λ is a tunable hyperparameter.
- Evaluation: Compare against the same GNN trained without consistency regularization and with traditional augmentation. Use stratified splits to ensure robustness in low-data regimes. Key Metrics: ROC-AUC, Precision-Recall AUC (AUPRC), especially critical for imbalanced classification tasks [58] [61].
Quantitative Performance Comparison
Table 1: Summary of Regularization Techniques and Their Impact on GNN Performance
| Technique | Core Mechanism | Primary Benefit | Typical Performance Gain | Key Application Context |
|---|---|---|---|---|
| DropEdge [63] | Random edge removal | Mitigates over-smoothing | Enables training deeper GNNs (e.g., 8+ layers) | Node classification on deep GNNs |
| Biased DropEdge (BDE) [63] | Selective inter-class edge removal | Improves information-to-noise ratio | Outperforms DropEdge on heterophilic graphs | Node classification, especially heterophilic graphs |
| Consistency Regularization (CRGNN) [58] | Alignment of augmented views | Enables safe data augmentation | Significant AUPRC improvement on small molecular datasets (<10k samples) | Molecular property prediction with limited data |
| Feature/Hyperplane Perturbation [66] | Co-shifting of inputs and weights | Alleviates overfitting from sparse features | Reported accuracy gains of 10-16% on bag-of-words datasets | Semi-supervised learning with sparse node features |
| Locality-aware Dropout [64] | Hardware-aware feature dropout | Accelerates training, reduces DRAM access | 1.48-3.02x training speedup, 34-55% fewer DRAM accesses | Large-scale GNN training where efficiency is critical |
Visualization of Workflows and Mechanisms
Diagram 1: CRGNN Protocol for Molecular Graphs
Diagram 2: Comparison of Dropout Strategies in GNNs
The Scientist's Toolkit: Essential Research Reagents & Materials
Table 2: Key Resources for Implementing GNN Regularization in Drug Discovery
| Category | Item/Resource | Description & Function | Example/Source |
|---|---|---|---|
| Datasets | MoleculeNet Benchmarks | Curated molecular datasets for property prediction (classification/regression). Essential for benchmarking. | BBBP, BACE, Tox21, ESOL [61] |
| GNN Models | MPNN, GIN, GCN, GAT | Foundational model architectures serving as backbones for implementing and testing regularization techniques. | [61] [62] |
| Regularization Techniques | DropEdge, DropNode, CRGNN | Algorithmic modules to be integrated into training loops to prevent overfitting. | Implementations from papers [58] [63] [64] |
| Evaluation Metrics | ROC-AUC, AUPRC, Accuracy, MSE | Standard metrics to quantify classification and regression performance, crucial for comparing techniques. | [61] |
| Software Frameworks | PyTorch Geometric (PyG), Deep Graph Library (DGL) | Primary libraries for efficient GNN model development, training, and evaluation. | https://pytorch-geometric.readthedocs.io/ |
| Computational Hardware | GPU with High VRAM, Optimized Accelerators | Necessary for training deep GNNs on large graphs. Specialized accelerators (e.g., for locality-aware dropout) can boost efficiency. | NVIDIA GPUs; Custom accelerators like LiGNN [64] |
This application note has detailed protocols and frameworks for applying advanced dropout and topological regularization in GNNs, directly contributing to the overarching goal of developing robust, generalizable models that resist overfitting. The summarized data indicates that the choice of regularization is highly context-dependent: DropEdge variants are potent against over-smoothing in deep architectures [63], consistency regularization is transformative for data-scarce molecular tasks [58], and topology-aware metrics like TC provide diagnostic insights for model failure [65]. For drug development professionals, these techniques offer a methodological toolkit to build more reliable predictive models from limited experimental data.
Future research directions include developing unified theoretical frameworks to understand the interaction between different regularization forms, creating automated methods for selecting optimal regularization strategies based on graph dataset properties (e.g., homophily ratio, feature sparsity), and further co-designing hardware-algorithm solutions like locality-aware dropout to make the training of large-scale GNNs on massive biomedical graphs feasible [64]. Integrating these advanced regularization techniques will be paramount for the next generation of trustworthy AI in scientific discovery.
Within the broader context of regularization techniques to prevent overfitting, Data Augmentation and Early Stopping stand out for their conceptual simplicity and significant impact on model generalization. Overfitting occurs when a machine learning model learns the training data too well, including its noise and irrelevant patterns, leading to poor performance on new, unseen data [67] [3]. In drug discovery, where datasets are often small and the cost of failed generalization is high, these techniques are particularly valuable [68].
Data Augmentation enhances model robustness by artificially expanding the training dataset, forcing the model to learn more generalizable features [69]. Early Stopping acts as a safeguard by halting the training process once performance on a validation set begins to degrade, a clear indicator of overfitting [67] [70]. This application note details the protocols for implementing these techniques, providing a practical toolkit for researchers and scientists in drug development.
Core Concepts and Definitions
Data Augmentation
Data Augmentation is a regularization technique that artificially increases the size and diversity of a training dataset by applying label-invariant transformations [69]. This process prevents overfitting by exposing the model to a more varied set of training examples, thereby improving its ability to generalize. It is especially crucial in data-scarce scenarios, such as early-stage drug discovery [68] [71].
Early Stopping
Early Stopping is a form of regularization that dynamically controls model complexity by monitoring performance during training. It involves ending the training process before the model fully converges on the training data, specifically when performance on a held-out validation set stops improving or starts to worsen [67] [69] [70]. This simple action prevents the model from memorizing the training data and promotes better generalization.
Technical Protocols and Application
Protocol 1: Implementing Data Augmentation
This protocol outlines the steps for implementing data augmentation, tailored for both image-based data and molecular representations like SMILES strings, which are common in drug discovery.
The following diagram illustrates the logical workflow for implementing a data augmentation strategy.
Step-by-Step Methodology
Define Label-Invariant Transformations: Identify operations that alter the data point without changing its fundamental label or meaning [69].
- For Image Data (e.g., Histology, Cellular Imaging): Standard transformations include rotation, flipping, cropping, color space adjustments (e.g., changing contrast, brightness), and noise injection [67] [69].
- For Molecular Data (e.g., SMILES Strings): Generate multiple, valid SMILES representations for the same molecule. Advanced techniques include Mixup, which creates new samples via convex combinations of inputs and their labels, and Cutout, which randomly removes portions of the data [69] [71].
Apply Transformations and Generate Dataset: Systematically apply the defined transformations to the original training data. The number of new samples generated per original sample is a key hyperparameter.
Combine and Train: The augmented dataset is combined with the original data. This expanded set is then used to train the model, forcing it to learn more robust and generalizable features [70].
Research Reagent Solutions
The table below details key computational tools and their functions for implementing data augmentation in a research environment.
Table 1: Essential Research Reagents and Tools for Data Augmentation
| Item | Function & Application | Example Use-Cases |
|---|---|---|
| Augmentation Libraries (e.g., Albumentations, Torchvision) | Provides pre-built functions for applying geometric and color transformations to image data. | Standardizing augmentation pipelines for histology or microscopy images [69]. |
| CHEMoinformatics Libraries (e.g., RDKit) | Handles molecular representations and enables SMILES enumeration and manipulation. | Generating multiple, valid SMILES strings for a compound library to augment a DTI dataset [71]. |
| Pre-trained Models (e.g., from Hugging Face) | NLP models like BERT can be fine-tuned on augmented SMILES data for task-specific prediction. | Predicting alpha-glucosidase inhibitors from augmented molecular data [71]. |
Protocol 2: Implementing Early Stopping
This protocol provides a detailed methodology for integrating Early Stopping into the model training routine.
The following diagram illustrates the decision-making process during training with Early Stopping.
Step-by-Step Methodology
Data Partitioning: Split the available data into three distinct sets: Training, Validation, and Test. The validation set is crucial for monitoring performance.
Define Monitoring Parameters:
- Validation Metric: Choose a metric to monitor (e.g., validation loss, accuracy) [69].
- Patience: Define the number of epochs to wait after the last time the validation metric improved before stopping [70].
- Checkpointing: Implement a routine to save the model weights whenever the validation metric shows an improvement.
Training Loop with Monitoring:
- At the end of each training epoch, evaluate the model on the validation set.
- If the validation metric improves, save the model as the current best and reset the patience counter.
- If there is no improvement, increment the patience counter.
- Stopping Criterion: If the patience counter exceeds the predefined
patiencevalue, stop the training and restore the model weights from the best saved checkpoint [67] [70].
Comparative Analysis and Quantitative Outcomes
The table below summarizes the performance and characteristics of Data Augmentation and Early Stopping, synthesizing information from the cited research.
Table 2: Comparative Analysis of Regularization Techniques
| Technique | Primary Mechanism | Key Hyperparameters | Pros | Cons | Reported Efficacy |
|---|---|---|---|---|---|
| Data Augmentation [67] [69] [70] | Increases data diversity and volume via transformations. | Type/strength of transformations, number of augmented samples. | Improves model robustness; exposes model to more data variations; essential for low-data regimes. | Can increase training time; not all transformations are valid for non-image data. | In a study predicting alpha-glucosidase inhibitors, data augmentation with SMILES strings was critical for building a robust BERT model, helping identify novel candidates [71]. |
| Early Stopping [67] [69] [72] | Halts training when validation performance degrades. | Patience, choice of validation metric. | Saves computational resources; simple to implement; no changes to model architecture. | Risk of underfitting if stopped too early; requires careful tuning of patience. | Described as a "quick, but rarely optimal, form of regularization" that can decrease test loss even as training loss increases [72]. |
Data Augmentation and Early Stopping are powerful, accessible techniques that directly address the challenge of overfitting by enhancing model generalization. Their simplicity belies their effectiveness, making them indispensable tools in the modern researcher's toolkit, especially in fields like drug discovery where data can be limited and models are complex [68].
The choice between these techniques is not mutually exclusive; they are often most powerful when used in conjunction. A robust strategy involves using Data Augmentation to create a richer training set and employing Early Stopping as a dynamic regulatory mechanism to halt training at the optimal point. This combined approach ensures that models are not only trained on diverse data but also that their training is concluded before they begin to over-specialize.
For researchers in drug development, mastering these techniques is a step toward more reliable and predictive computational models. Future work may explore more advanced, domain-specific augmentation methods for molecular data and the development of more adaptive early stopping criteria. By integrating these simple yet powerful techniques, the path to discovering novel therapeutics becomes more efficient and grounded in robust machine learning practice.
Troubleshooting and Optimizing Regularization: Strategies for Reliable Model Performance
In the pursuit of robust machine learning models for biomedical research, such as predicting anticancer drug responses, the challenge often lies not in the model's ability to learn from training data, but in its capacity to generalize to unseen clinical data. This challenge is formalized through the twin problems of underfitting and overfitting [73]. Overfitting occurs when a model becomes too complex, learning not only the underlying patterns in the training data but also the noise, leading to poor performance on new, unseen data [73] [74]. In contrast, underfitting occurs when a model is too simple to capture the relevant relationships in the data, resulting in poor performance on both training and test sets [73] [74].
Regularization provides a powerful solution to this problem by introducing a penalty term to the model's objective function, thereby controlling model complexity and encouraging simpler, more generalizable models [74] [35]. The core of effective regularization lies in hyperparameter tuning—the process of identifying the optimal value for the regularization strength (often denoted as λ or alpha) to perfectly balance the bias-variance tradeoff [74] [75]. For researchers in drug development, where models are built on high-dimensional genomic and clinical data, mastering this balance is critical for creating predictive tools that can reliably inform treatment decisions [76] [77].
Theoretical Foundation: The Bias-Variance Tradeoff
The need for regularization is fundamentally rooted in the bias-variance tradeoff, a core concept in machine learning that describes the tension between a model's simplicity and its accuracy [74].
- Bias Error is the error introduced by the model's simplifying assumptions. A model with high bias pays little attention to the training data and oversimplifies the problem, leading to underfitting. Indicators of high bias include high training error and high validation error [73] [74].
- Variance Error is the error introduced by the model's excessive sensitivity to small fluctuations in the training set. A model with high variance pays too much attention to the training data, including its noise, leading to overfitting. This is indicated by a low training error but a high validation error [73] [74].
The relationship between bias, variance, and the total model error (often Mean Squared Error) can be expressed as: MSE = Bias² + Variance + Irreducible Error [74]
The goal of regularization is to minimize this total error by finding a sweet spot where the increase in bias is justified by a greater reduction in variance, thus improving the model's generalizability [74]. As illustrated in the theoretical error curve below, the test error decreases as model complexity increases until an optimal point, after which overfitting sets in and the test error begins to rise again.
Regularization Techniques and Their Mechanisms
Different regularization techniques impose different kinds of constraints on the model. The general form of a regularized optimization problem is:
Regularized Loss = Original Loss + λ × Regularization Term [73] [74]
The following table summarizes the key characteristics of the three primary regularization techniques.
Table 1: Comparison of Primary Regularization Techniques
| Technique | Regularization Term | Mechanism | Primary Effect | Best For |
|---|---|---|---|---|
| L1 (Lasso) [73] [35] | ∑∣wᵢ∣ | Adds absolute value of weights to loss. | Encourages sparsity; drives less important weights to exactly zero. | Feature selection in high-dimensional data (e.g., genomics). |
| L2 (Ridge) [73] [35] | ∑wᵢ² | Adds squared value of weights to loss. | Shrinks all weights uniformly but keeps them non-zero. | Handling multicollinearity; general overfitting prevention. |
| Elastic Net [35] | λ[(1-α)∑∣wᵢ∣ + α∑wᵢ²] | Combines L1 and L2 penalties. | Balances feature selection (L1) and weight shrinkage (L2). | Datasets with correlated features and high dimensionality. |
In addition to these, Dropout is a highly effective technique specific to neural networks. It works by randomly "dropping out" a fraction of neurons during each training iteration, which prevents complex co-adaptations of neurons and forces the network to learn more robust features [73] [78].
Hyperparameter Tuning Methods for Regularization Strength
Selecting the right regularization hyperparameter (λ or alpha) is an empirical process that requires systematic experimentation. The following workflow outlines the standard protocol for tuning regularization strength.
The most common strategies for this tuning process are:
- Grid Search: An exhaustive search over a predefined set of hyperparameter values. It is guaranteed to find the best combination within the grid but is computationally expensive, especially for large search spaces [79] [75].
- Random Search: Instead of searching exhaustively, random search samples a fixed number of hyperparameter combinations from specified distributions. It is often more efficient than grid search for high-dimensional spaces, as it can discover good hyperparameters without searching every possible combination [79] [80].
- Bayesian Optimization: A more advanced technique that builds a probabilistic model of the function mapping hyperparameters to model performance. It uses this model to intelligently select the most promising hyperparameters to evaluate next, typically requiring fewer iterations to find the optimum [79] [80].
Table 2: Quantitative Comparison of Hyperparameter Tuning Methods
| Method | Search Principle | Computational Cost | Best-Suited Scenario | Key Advantage |
|---|---|---|---|---|
| Grid Search [79] | Exhaustive brute-force. | Very High. | Small, discrete hyperparameter spaces (e.g., 3-4 parameters). | Guarantees finding best combo within the defined grid. |
| Random Search [79] [80] | Random sampling from distributions. | Moderate to High. | Larger, high-dimensional search spaces. | More efficient than grid search; good for initial exploration. |
| Bayesian Optimization [79] [80] | Probabilistic, adaptive. | Lower (per iteration). | When model training is very slow/expensive. | Finds good parameters with fewer iterations; smarter search. |
Application Notes: Protocol for Drug Sensitivity Prediction
The following protocol details the application of regularization and hyperparameter tuning for predicting cancer drug sensitivity, based on methodologies from recent literature [76] [77].
Experimental Workflow
Step-by-Step Protocol
Step 1: Data Preparation and Feature Engineering
- Data Source: Collect and preprocess clinical text data from electronic medical records (e.g., radiology reports) or structured genomic data (e.g., GDSC, CCLE datasets) [76] [77].
- Handling Missing Values: Remove cell lines or patient samples with >50% missing data. Impute remaining missing values using k-nearest neighbors (KNN) imputation [77].
- Feature Engineering (for clinical text): Apply Latent Dirichlet Allocation (LDA), an unsupervised topic model, to encode clinical text into a probability distribution over latent topics. This creates a low-dimensional, dense feature vector (LDA representation) for each patient [76].
- Label Definition: For drug response, use the IC50 value (half-maximal inhibitory concentration). Define a binary label (sensitive/resistant) by setting a threshold, typically the median IC50 across all cell lines for a given drug [77].
Step 2: Model Architecture and Regularization Setup
- Model Selection: Design a neural network classifier. The input layer size should match the dimension of the feature vector (e.g., the number of LDA topics or genomic features) [76].
- Incorporate Regularization:
- Define Loss Function: Use binary cross-entropy loss, which can be combined with the L2 penalty term [74].
Step 3: Systematic Hyperparameter Tuning
- Primary Target: The regularization strength hyperparameter (λ for L2, dropout rate for Dropout).
- Tuning Method: Employ Bayesian Optimization or RandomizedSearchCV due to the computational cost of training neural networks.
- Search Space:
- Validation: Use stratified k-fold cross-validation (e.g., k=5) to evaluate each hyperparameter combination robustly [79] [77].
Step 4: Model Validation and Interpretation
- Final Evaluation: Retrain the model on the entire training set using the optimal hyperparameters found. Evaluate its final performance on a completely held-out test set or an independent clinical cohort [76] [77].
- Performance Metrics: Report Precision, Recall, F1-score, Accuracy, and the Area Under the ROC Curve (AUC). Successful applications have achieved AUCs of 0.81 or higher in predicting drug efficacy [76].
- Interpretability: Analyze the weights of the trained model. In models with L1 regularization, features with zero weights can be discarded, aiding in biomarker discovery.
The Scientist's Toolkit: Research Reagent Solutions
Table 3: Essential Materials and Computational Tools for Drug Sensitivity Prediction
| Item / Reagent | Function / Purpose | Example / Specification |
|---|---|---|
| Cancer Cell Line Databases | Provides genomic features and drug response (IC50) labels for model training. | GDSC (Genomics of Drug Sensitivity in Cancer), CCLE (Cancer Cell Line Encyclopedia) [77]. |
| Clinical Text Data | Unstructured data source for predicting drug efficacy via topic modeling. | Electronic Medical Records (EMRs), Radiology reports (CT, MRI) [76]. |
| LDA (Latent Dirichlet Allocation) | Unsupervised model for feature engineering; encodes text into topic probability vectors. | Implemented via libraries like gensim or scikit-learn [76]. |
| Neural Network Framework | Provides the environment for building, training, and regularizing the predictive model. | TensorFlow, PyTorch, or scikit-learn (for simpler networks). |
| Hyperparameter Tuning Library | Automates the search for optimal regularization parameters. | Scikit-learn's RandomizedSearchCV or BayesianOptimization packages [79] [80]. |
Balancing regularization strength through meticulous hyperparameter tuning is not merely a technical exercise but a critical step in developing reliable and generalizable predictive models in drug development and precision medicine. By systematically navigating the bias-variance tradeoff using techniques like L1/L2 regularization, dropout, and advanced tuning methods like Bayesian optimization, researchers can construct models that robustly capture the underlying biological signals—be it from genomic data or clinical text—without succumbing to overfitting on the training cohort. This disciplined approach is foundational to translating computational models into clinically actionable tools for predicting individual patient responses to anticancer drugs.
In the pursuit of robust and generalizable scientific findings, particularly in high-stakes fields like drug development, preventing overfitting is a fundamental necessity. Overfitting occurs when a model learns the training data too well, including its noise and random fluctuations, resulting in poor performance on new, unseen data [34]. This compromises the model's ability to generalize and can lead to misleading conclusions, wasted resources, and, in healthcare, potential risks to patient safety [81] [82].
Regularization encompasses a set of techniques designed explicitly to mitigate overfitting by intentionally simplifying the model or penalizing excessive complexity [29] [7]. The ultimate goal of regularization is to enhance a model's generalizability, trading a marginal decrease in training accuracy for a significant increase in predictive performance on test data [29]. This application note provides a structured framework to help researchers and scientists select appropriate regularization techniques based on their specific data types and research goals.
Background: Overfitting and the Rationale for Regularization
The Bias-Variance Tradeoff
Understanding regularization requires familiarity with the bias-variance tradeoff, a core concept in machine learning [29].
- Bias measures the average difference between a model's predictions and the true values. High bias can cause underfitting, where the model is too simple to capture underlying patterns in the data [83].
- Variance measures a model's sensitivity to fluctuations in the training data. High variance can cause overfitting, where the model learns the noise instead of the signal [83].
Regularization techniques aim to balance this tradeoff, typically by reducing variance at the expense of a slight increase in bias, leading to better overall generalization [29].
Consequences of Overfitting in Research
The impacts of overfitting extend beyond technical metrics [81] [82]. In academic and industrial research, it can:
- Erode Trust: Irreproducible findings undermine confidence in scientific research.
- Misguide Policies and Decisions: Ineffective or harmful policies and treatments can be based on non-generalizable models.
- Consume Resources: Significant resources can be allocated to pursuing false leads based on overfitted results.
- Raise Ethical Concerns: Flawed predictive models in healthcare or finance can adversely affect vulnerable populations [81].
A Decision Framework for Selecting Regularization Techniques
The following framework guides the selection of regularization methods based on data characteristics and research objectives. The subsequent sections provide detailed explanations of each method listed.
Technique Selection Guide
Table 1: A decision framework for selecting regularization techniques based on data type and research goal.
| Primary Data Type | Research Goal / Problem | Recommended Regularization Technique(s) | Key Rationale |
|---|---|---|---|
| High-Dimensional Data (e.g., Genomics, Transcriptomics) | Feature selection; identifying the most relevant predictors from a large set. | Lasso (L1) Regression [29] | Shrinks coefficients of irrelevant features to zero, performing automatic feature selection. |
| High-Dimensional Data with Correlated Features | Prediction accuracy; when you suspect many features are relevant and correlated. | Ridge (L2) Regression [29] | Shrinks coefficients without zeroing them out, handling multicollinearity more effectively. |
| High-Dimensional Data with Unknown Feature Relevance | A balanced approach for both feature selection and handling correlated features. | Elastic Net [29] | Combines the L1 and L2 penalties, offering a robust compromise. |
| Image Data | Improving model generalization with limited training data. | Data Augmentation [34] [83] | Artificially expands the training set by creating modified versions of existing images, teaching the model invariance to transformations. |
| Sequential or Time-Series Data | Preventing overfitting during the training of recurrent neural networks. | Dropout [29] [83] | Randomly omits units from the network during training, preventing complex co-adaptations. |
| All Data Types, Large Datasets | Efficiently training complex models (e.g., Deep Neural Networks) without overfitting. | Early Stopping [34] [83] | Halts training when performance on a validation set stops improving, preventing the model from learning noise. |
| All Data Types | Obtaining a reliable estimate of model performance and mitigating overfitting. | Cross-Validation [34] [84] | Assesses how the model will generalize to an independent dataset by partitioning the data into training and validation sets. |
Workflow for Implementation
The following diagram outlines a generalized protocol for applying this decision framework to a research problem.
Detailed Experimental Protocols
This section provides step-by-step methodologies for implementing key regularization techniques cited in the framework.
Protocol for k-Fold Cross-Validation
Cross-validation is a foundational practice for both detecting overfitting and tuning model parameters [34] [83].
1. Objective: To obtain a robust estimate of model generalization error and mitigate overfitting by leveraging the entire dataset for training and validation.
2. Materials/Reagents:
- Dataset: A labeled dataset that has been pre-processed and cleaned.
- Machine Learning Algorithm: Any algorithm of choice (e.g., Logistic Regression, Random Forest).
3. Procedure:
1. Partition Data: Randomly shuffle the dataset and split it into k equally sized folds (typical values for k are 5 or 10).
2. Iterate Training: For each unique fold i (where i ranges from 1 to k):
a. Set Validation Set: Designate fold i as the validation set.
b. Set Training Set: Combine the remaining k-1 folds to form the training set.
c. Train Model: Train the model on the training set.
d. Validate Model: Use the trained model to generate predictions for the validation set and calculate the performance score (e.g., accuracy, F1-score).
3. Aggregate Results: The final performance estimate is the average of the k performance scores obtained from each iteration. A high variance in scores between folds may indicate overfitting.
Protocol for L1 and L2 Regularization in Linear Models
This protocol details the implementation of Lasso (L1) and Ridge (L2) regularization in the context of regression models [29].
1. Objective: To constrain the size of model coefficients, preventing any single feature from having an exaggerated influence, thereby improving generalization.
2. Materials/Reagents:
- Dataset: A dataset with numeric features and a target variable.
- Software: A statistical software package (e.g., Python with Scikit-learn, R).
3. Procedure:
1. Preprocess Data: Standardize or normalize all features. This is critical because the penalty term is applied equally to all coefficients.
2. Define Model: Select either Lasso (L1) or Ridge (L2) regression.
* The cost function minimized is: Loss Function + λ * Σ|coefficients| for L1.
* The cost function minimized is: Loss Function + λ * Σ(coefficients²) for L2.
3. Hyperparameter Tuning:
a. Define a range of values for the regularization hyperparameter, λ (often called alpha in software libraries).
b. Use cross-validation (see Protocol 4.1) to train the model with each λ value.
c. Identify the λ value that yields the best cross-validation performance.
4. Final Training & Analysis: Train the final model on the entire training set using the optimal λ.
* For Lasso, analyze the resulting model: coefficients shrunk to zero indicate features that have been excluded.
* For Ridge, analyze the magnitude of the coefficients to understand feature importance.
Protocol for Data Augmentation in Image Analysis
Data augmentation is a powerful technique for increasing the effective size and diversity of a training dataset [34] [83].
1. Objective: To improve model robustness and generalization by artificially creating variations of training images that the model is likely to encounter in the real world.
2. Materials/Reagents:
- Dataset: A set of training images.
- Software: A deep learning framework with augmentation capabilities (e.g., TensorFlow, PyTorch, Keras).
3. Procedure: 1. Define Augmentation Strategy: Identify a set of transformations that preserve the semantic label of the image. Common transformations include: * Geometric: Random rotation (±15°), flipping (horizontal/vertical), zooming (90-110%), and shifting. * Photometric: Adjusting brightness, contrast, and saturation. 2. Integrate Pipeline: Integrate the augmentation transformations into the training data loading pipeline. It is critical that augmentation is applied on-the-fly during training, not to the original dataset permanently. 3. Train Model: Train the model using the augmented data stream. The model will see a slightly different version of each image in every epoch, forcing it to learn more invariant features. 4. Validate: Evaluate the model on a non-augmented validation set to monitor performance gains.
The Scientist's Toolkit: Key Research Reagents and Solutions
Table 2: Essential software tools and libraries for implementing regularization techniques in research.
| Tool / Library Name | Primary Function | Application in Regularization |
|---|---|---|
| Scikit-learn [81] | A comprehensive library for machine learning in Python. | Provides built-in implementations for L1, L2, Elastic Net, and Cross-Validation, making it easy to apply these techniques to standard models. |
| TensorFlow / PyTorch [81] | Open-source platforms for developing and training deep learning models. | Offer advanced functionalities for dropout, weight decay, and data augmentation within complex neural network architectures. |
| R & SAS [81] | Statistical computing and data analysis environments. | Widely used in academic research for statistical analysis, offering robust methods for detecting and addressing overfitting in traditional models. |
| Amazon SageMaker [34] | A managed service for building, training, and deploying ML models. | Includes automated tools that can detect overfitting and support early stopping, simplifying model management in cloud environments. |
Integration with Broader Research Best Practices
Incorporating regularization is one component of a rigorous research methodology. Other critical practices include:
- Adherence to Reporting Standards: In clinical trial research, using guidelines like the SPIRIT 2025 statement for protocols ensures transparency and completeness, which helps reviewers assess the risk of bias and overfitting in the study design [85].
- Managing Imbalanced Data: When dealing with unequal class distributions, techniques such as using the
AUC_weightedmetric or resampling (up-sampling the minority class/down-sampling the majority class) should be employed alongside regularization to prevent biased models [84]. - Independent Validation: The ultimate test for overfitting is a model's performance on a completely held-out test set that was not used during the training or validation phases [82]. This provides the best estimate of real-world performance.
Addressing Computational Challenges and Increased Training Time
In the broader research on regularization techniques to prevent overfitting, a significant and often parallel challenge is the substantial computational cost and increased training time associated with modern machine learning models, particularly in deep learning. As models grow in complexity to capture intricate patterns, their demand for computational resources and time escalates, posing a major bottleneck for research and development, including in critical areas like drug discovery [4] [86]. This document outlines application notes and experimental protocols to systematically address these challenges, enabling more efficient research without compromising the integrity of investigations into regularization.
Quantitative Analysis of Computational Trade-offs
The selection of regularization techniques and optimization strategies involves inherent trade-offs between performance, computational cost, and model size. The table below summarizes quantitative data from recent research to aid in decision-making.
Table 1: Quantitative Comparison of Regularization and Optimization Techniques
| Technique | Impact on Accuracy/Generalization | Impact on Training Time | Impact on Model Size/Inference | Key Findings |
|---|---|---|---|---|
| Dropout + Data Augmentation | ↑ Validation Accuracy (up to 82.37% for ResNet-18) [4] | Varies (Potential increase due to complexity) | Minimal impact on final model size | Most effective when combined; significantly reduces overfitting gap [87] [4] |
| Early Stopping | Prevents degradation of validation loss [87] | ↓ Training Time (Halts unnecessary epochs) | No impact | Reduces computational costs by preventing over-training [87] [88] |
| Pruning | Can maintain or slightly improve accuracy after fine-tuning [89] | ↑ Training Time (Iterative pruning & fine-tuning) | ↓↓ Model Size (Dramatic storage savings) | Magnitude-based pruning can remove redundant weights [86] [89] |
| Quantization (FP32 to INT8) | Minimal to moderate accuracy loss [89] | ↓ Inference Time (Hardware-dependent) | ↓↓ Model Size (~72% storage saving) [89] | Post-training quantization (PTQ) requires no retraining [86] [89] |
| Weight Clustering | Can lead to better accuracy in some scenarios [89] | ↓ Inference Time (Fewer unique weight values) | ↓↓ Model Size (~72% storage saving) [89] | Groups weights into clusters, sharing single value [89] |
Table 2: AI Accelerator Performance Characteristics (2025 Landscape)
| Hardware Type | Typical Use Case | Relative Energy Efficiency | Key Strength | Key Weakness |
|---|---|---|---|---|
| GPUs (e.g., NVIDIA H100) | Flexible Model Training, General R&D | Baseline | Mature software ecosystem (CUDA), versatility [90] | Over-provisioning, higher power consumption [90] |
| ASICs (e.g., Google TPU, AWS Trainium) | Large-Scale Inference, Specific Workloads | High | High throughput & performance/watt for targeted tasks [90] | High upfront cost, limited flexibility [90] |
| FPGAs (e.g., AMD FPGAs) | Prototyping, Evolving Algorithms | Moderate | Reconfigurable for custom ML pipelines [90] | Requires specialized hardware knowledge [90] |
| NPUs/LPUs (e.g., Groq LPU) | Edge Computing, Low-Latency Inference | High | Extreme low-latency for specific tasks like NLP [90] | Highly specialized, not for general-purpose training [90] |
Experimental Protocols for Computational Efficiency
The following protocols provide detailed methodologies for integrating the techniques described above into a coherent research workflow.
Protocol: Controlled Regularization Experimentation
Objective: To quantitatively evaluate the effect of different regularization techniques on generalization and training dynamics using a controlled experimental setup [4].
Materials:
- Standardized dataset (e.g., Imagenette [4])
- Baseline model architecture (e.g., CNN [4]) and a more complex one (e.g., ResNet-18 [4])
- Deep Learning Framework (e.g., PyTorch or TensorFlow)
Procedure:
- Dataset Preparation: Split the dataset into training, validation, and test sets. Apply consistent preprocessing.
- Baseline Establishment: Train the baseline and complex models without any regularization. Record final training/validation accuracy and the number of epochs until convergence.
- Regularization Application: Train the models again, systematically introducing one regularization technique at a time (e.g., L2 weight decay, Dropout, Data Augmentation). Use the same random seed for initialization to ensure comparability.
- Hyperparameter Tuning: For each technique, perform a hyperparameter search (e.g., for dropout rate, L2 penalty λ) using the validation set. Tools like Optuna or Ray Tune can automate this [86].
- Combined Strategy: Train the models with a combination of the most effective techniques from step 4.
- Monitoring: For each experiment, log:
- Training and validation loss/accuracy for each epoch.
- Total wall-clock training time.
- Computational resource usage (e.g., GPU hours).
- Analysis: Calculate the generalization gap (training accuracy - validation accuracy) for each run. The optimal regularization strategy minimizes this gap and the total training time without sacrificing final validation accuracy.
Protocol: Model Compression via Pruning and Quantization
Objective: To significantly reduce the memory footprint and inference time of a trained model with minimal impact on accuracy [89].
Materials:
- A pre-trained model.
- A calibration dataset (a subset of the training data not used in validation).
- Framework support for pruning/quantization (e.g., TensorFlow Model Optimization Toolkit).
Procedure: Part A: Pruning
- Model Preparation: Load the pre-trained model.
- Pruning Setup: Apply a magnitude-based pruning algorithm, specifying a target sparsity (e.g., 50%) or a pruning schedule.
- Fine-Tuning: Retrain the pruned model for a few epochs. This step is crucial for recovering any lost accuracy [89].
- Iteration (Optional): Repeat steps 2 and 3 iteratively to achieve higher sparsity (iterative pruning) [86].
Part B: Quantization
- Post-Training Quantization (PTQ): For a quick deployment, apply PTQ to the (pruned) model. This converts weights from FP32 to a lower precision (e.g., FP16 or INT8) without retraining [86] [89].
- Quantization-Aware Training (QAT - Optional): For better accuracy, simulate quantization during a fine-tuning phase. This makes the model robust to the precision loss before actual conversion [89].
- Evaluation: Benchmark the final compressed model on the test set. Report accuracy, model size, and inference latency.
Protocol: Implementing Early Stopping with Patience
Objective: To automatically halt training when the model shows signs of overfitting, thereby saving computational resources [87] [88].
Materials:
- A model in training.
- A dedicated validation set.
- Training framework that supports callbacks (e.g., Keras, Fast.ai).
Procedure:
- Define Metric: Choose a monitored metric (typically validation loss).
- Set Patience: Define a "patience" parameter: the number of epochs with no improvement in the monitored metric after which training will stop. A common starting value is 10 epochs.
- Configure Saving: Simultaneously configure the framework to save the model checkpoint from the epoch with the best validation score.
- Execution: Begin training. The callback will continuously evaluate the validation set.
- Termination: Training will stop automatically once the patience period is exhausted. The best saved model will be restored for evaluation and use.
Workflow Visualizations
Regularization Optimization Pathway
The following diagram illustrates the logical workflow for selecting and applying techniques to balance overfitting prevention and computational load.
Model Compression and Deployment Pipeline
This diagram details the sequential workflow for compressing a model to reduce its computational footprint for deployment.
The Scientist's Toolkit: Research Reagent Solutions
This section catalogues essential tools, datasets, and software crucial for conducting experiments in regularization and computational optimization.
Table 3: Essential Research Tools and Materials
| Item Name | Function/Application | Example/Reference |
|---|---|---|
| Standardized Datasets | Provides a benchmark for controlled experiments and fair comparison of techniques. | Imagenette [4], CIFAR-10 [91], MNIST [91] |
| Deep Learning Frameworks | Provides the foundational software environment for building, training, and evaluating models. | TensorFlow/Keras, PyTorch, Ultralytics YOLO [91] [88] |
| Hyperparameter Tuning Tools | Automates the search for optimal model and regularization parameters. | Optuna, Ray Tune [86] |
| Model Optimization Toolkits | Provides specialized libraries for applying compression techniques like pruning and quantization. | TensorFlow Model Optimization Toolkit [89] |
| AI Accelerators (Hardware) | Specialized hardware to drastically reduce training and inference time for large models. | Google TPU, NVIDIA GPUs, Groq LPU [90] |
| Visualization Libraries | Enables monitoring of training dynamics, loss curves, and model performance. | TensorBoard, Weights & Biases, Matplotlib |
| XGBoost | An optimized gradient boosting library effective for tabular data tasks, with built-in regularization. | Useful for non-deep learning benchmarks and feature selection [86] |
Best Practices for Integrating Regularization into a Cross-Validation Workflow
1. Introduction and Rationale The pursuit of robust, generalizable predictive models is paramount in scientific research, particularly in high-stakes fields like drug development where model overfitting can lead to costly misdirection [32] [16]. Regularization techniques, which penalize model complexity to prevent overfitting, are a cornerstone of modern machine learning [92] [93]. However, their efficacy is critically dependent on the proper selection of hyperparameters (e.g., the regularization strength, λ). Integrating regularization within a cross-validation (CV) workflow provides a rigorous, data-driven framework for hyperparameter tuning and unbiased performance estimation, ensuring that the final model balances complexity with generalizability [94] [84]. This protocol outlines best practices for this integration, framed within a thesis on advanced regularization strategies.
2. Core Principles and Quantitative Comparison of Regularization Techniques Regularization works by adding a penalty term to the model's loss function. The choice of penalty induces different properties in the final model [92] [95].
Table 1: Comparison of Common Regularization Techniques for Linear Models
| Technique | Penalty Term (pen(θ)) | Key Property | Primary Use Case | Effect on Coefficients |
|---|---|---|---|---|
| L2 (Ridge) | λ∑θ_j² | Shrinkage, Stability | Correlated features, prevent overfitting | Shrinks coefficients smoothly towards, but not to, zero. |
| L1 (Lasso) | λ∑|θ_j| | Sparsity, Feature Selection | High-dimensional data (p >> n), interpretability | Can force coefficients to exactly zero, performing feature selection. |
| Elastic Net | λ[α∑|θj| + (1-α)∑θj²] | Hybrid | Very high-dimensional data with correlated features | Balances shrinkage and selection based on mixing parameter α. |
Mathematical Formulation: For a linear model, the regularized objective function is: β̂(λ) = argminⱼ { ‖y - Xβ‖² + P(β; λ) }, where P(β; λ) is the penalty from Table 1 [94].
3. Detailed Experimental Protocol for Integrated Regularization & CV This protocol describes a k-fold cross-validation workflow with integrated hyperparameter tuning for a regularized regression model.
Protocol 3.1: Nested Cross-Validation for Unbiased Evaluation Objective: To obtain a robust estimate of model performance on unseen data while tuning regularization parameters.
- Data Partitioning: Split the full dataset into an outer Test Hold-Out Set (e.g., 20%) and an outer Training/Validation Set (80%).
- Outer Loop (Performance Estimation): Divide the outer Training/Validation set into k folds (e.g., k=5 or 10). For each outer fold i: a. Outer Training Set: k-1 folds. b. Outer Validation Set: The remaining 1 fold. c. Inner Loop (Hyperparameter Tuning): On the Outer Training Set, perform another, independent k-fold CV (e.g., 5-fold). For each candidate value of λ (and α for Elastic Net) from a predefined grid: i. Fit the model on the inner training folds. ii. Evaluate performance (e.g., Mean Squared Error) on the inner validation fold. iii.Average performance across all inner folds for that hyperparameter set. d. Select Optimal Hyperparameters: Choose the set (λ, α) that yields the best average inner CV performance. e. Train Final Inner Model: Retrain a model using the entire Outer Training Set and the optimal hyperparameters (λ, α). f. Evaluate: Score this model on the held-out Outer Validation Set (fold i).
- Aggregate Performance: The average score across all k outer validation folds provides an unbiased estimate of the model's generalization error [94] [96].
- Final Model Training: Train a final model on the entire original Training/Validation Set (100%) using the hyperparameters that were most frequently optimal or that gave the best average outer performance. Evaluate this model once on the untouched Test Hold-Out Set for a final report.
Protocol 3.2: Automated Hyperparameter Optimization (AHPO) Integration Objective: To efficiently search the hyperparameter space beyond a simple grid.
- Within the inner CV loop (Protocol 3.1, Step 2c), employ advanced search strategies: a. Bayesian Optimization: Models the relationship between hyperparameters and CV score to intelligently select the next candidate values. b. Random Search: Samples hyperparameters from defined distributions, often more efficient than grid search.
- Utilize HPC resources to parallelize the training of models for different hyperparameter candidates across inner CV folds, making nested CV computationally feasible [96].
4. Visualization of the Integrated Workflow
Title: Nested Cross-Validation Workflow with Integrated Regularization Tuning
5. The Scientist's Toolkit: Key Research Reagents & Solutions Table 2: Essential Tools for Implementing Regularized CV Workflows
| Item | Function & Description | Example/Implementation |
|---|---|---|
| Programming Language & Core Library | Provides foundational algorithms for models, CV, and optimization. | Python with scikit-learn (LinearRegression, Lasso, Ridge, ElasticNet, GridSearchCV, RandomizedSearchCV) [92]. |
| Hyperparameter Optimization Suite | Enables efficient search over hyperparameter space beyond grid search. | scikit-optimize, Optuna, or Ray Tune. |
| Performance Metrics | Quantitative measures for model evaluation and comparison during CV. | Mean Squared Error (MSE), R² (regression); AUC, F1-Score (classification) [94] [84]. |
| High-Performance Computing (HPC) Resources | Parallelizes the computationally intensive nested CV and AHPO processes. | Multi-core CPUs, GPU clusters, or cloud computing platforms (e.g., Azure ML with Automated ML) [84] [96]. |
| Data Visualization Toolkit | Creates learning curves, validation curves, and coefficient paths to diagnose bias-variance trade-off. | matplotlib, seaborn. Coefficient paths show how feature weights change with λ [95]. |
| Regularization-Aware Diagnostic | Specifically visualizes the effect of the regularization parameter. | Validation curve plotting CV score vs. λ to identify the region of optimal model complexity [93]. |
6. Conclusion Integrating regularization within a structured cross-validation workflow, particularly using nested designs and automated hyperparameter optimization, is a best-practice methodology for developing predictive models that generalize reliably to new data [94] [96]. This approach quantitatively manages the bias-variance trade-off, mitigates overfitting, and provides realistic performance estimates, which is essential for building trust in models used for critical research and development decisions in fields like pharmaceutical sciences [95].
In the field of computational toxicology, machine learning models face a significant challenge: their exceptional performance on training data often fails to generalize to novel chemical compounds due to overfitting. This case study explores the systematic application of regularization techniques to develop a robust, generalizable predictive toxicity model within a multimodal deep learning framework. As pharmaceutical companies increasingly rely on in silico predictions to reduce costly late-stage failures, implementing proper regularization becomes paramount for model reliability in real-world drug discovery applications [97].
The fundamental dilemma in predictive toxicology revolves around the bias-variance tradeoff. Powerful deep learning architectures can memorize noise and idiosyncrasies in training data, compromising their ability to accurately assess toxicity for new chemical entities. Regularization addresses this by intentionally constraining model complexity, forcing the learning algorithm to prioritize the most relevant patterns [98]. This study demonstrates how strategic regularization transforms an overfit toxicity predictor into a validated tool for preclinical safety assessment.
Experimental Design and Model Architecture
Dataset Composition and Features
The integrated dataset combines chemical property data and molecular structure images curated from diverse public sources, including PubChem and eChemPortal [99]. The dataset encompasses multiple toxicological endpoints, enabling multi-label toxicity prediction for comprehensive safety profiling.
Key dataset characteristics:
- 4,179 molecular structure images with associated chemical properties
- Binary toxicity labels across multiple endpoints
- Numerical descriptors including molecular weight, logP, topological polar surface area, and other physicochemical properties
- Categorical features encoding structural alerts and functional groups
Multimodal Architecture
The proposed model employs a joint fusion mechanism integrating two complementary data modalities through specialized processing pathways:
Figure 1: Multimodal architecture combining image and numerical data processing.
Image Processing Pathway
Molecular structure images are processed using a Vision Transformer (ViT) architecture, specifically the ViT-Base/16 model pre-trained on ImageNet-21k and fine-tuned on molecular structures [99]. The model processes input images as 16×16-pixel patches at 224×224 resolution, extracting a 128-dimensional feature vector. The ViT component contains approximately 98,688 trainable parameters in its final MLP dimensionality reduction layer [99].
Numerical Data Processing Pathway
Chemical property data is processed through a Multilayer Perceptron (MLP) with progressively reducing dimensions (256 → 128 units). Each fully connected layer is followed by batch normalization and ReLU activation, with the final layer producing a 128-dimensional feature vector [99].
Regularization Framework and Implementation
Comprehensive Regularization Strategy
Our regularization approach implements multiple complementary techniques throughout the model architecture:
Figure 2: Comprehensive regularization strategy framework.
Experimental Protocols
Protocol 1: L1/L2 Regularization Implementation
Objective: Apply parameter penalization to MLP layers to prevent overfitting without compromising feature extraction capability.
Materials:
- PyTorch or TensorFlow deep learning framework
- Standardized chemical descriptor dataset
- Molecular image dataset (224×224 resolution)
Procedure:
- Initialize MLP with sequential layers (256 → 128 units)
- Apply L2 regularization (weight decay=0.01) to all linear layers
- Implement L1 regularization (λ=0.001) specifically to the first hidden layer to encourage feature selection
- Use Adam optimizer with learning rate 0.001 and betas (0.9, 0.999)
- Train for 200 epochs with batch size 32
- Monitor training and validation loss curves
Validation:
- Compare training vs. validation accuracy divergence
- Analyze weight distributions across layers
- Calculate sparsity ratio in L1-regularized layer
Protocol 2: Dropout Configuration
Objective: Implement spatial and standard dropout to prevent co-adaptation of features in both ViT and MLP pathways.
Procedure:
- ViT Pathway: Apply dropout rate of 0.1 to attention layers and 0.2 to MLP classifier head
- MLP Pathway: Implement dropout rate of 0.3 after each hidden layer
- Use Monte Carlo dropout during inference for uncertainty estimation
- Gradually increase dropout rates if overfitting persists (max 0.5)
Validation:
- Perform multiple forward passes with dropout enabled
- Calculate prediction variance across runs
- Monitor training/validation loss gap
Protocol 3: Early Stopping with Validation
Objective: Prevent overfitting by monitoring validation performance and halting training when generalization deteriorates.
Procedure:
- Split data into training (70%), validation (15%), test (15%)
- Configure early stopping with patience=20 epochs and delta threshold=0.001
- Monitor validation F1-score as primary metric
- Save model checkpoints when validation performance improves
- Restore best-performing model at training completion
- Implement learning rate reduction (factor=0.5) after 10 epochs without improvement
Validation:
- Compare final epoch count with and without early stopping
- Analyze validation metric stability
- Evaluate test set performance
Hyperparameter Optimization
Table 1: Regularization hyperparameters and search spaces
| Technique | Hyperparameter | Search Space | Optimal Value | Implementation Details |
|---|---|---|---|---|
| L2 Regularization | Weight Decay | [1e-5, 1e-4, 1e-3, 1e-2] | 0.01 | Applied to all linear layers in MLP and ViT classifier |
| L1 Regularization | λ Penalty | [1e-4, 1e-3, 1e-2] | 0.001 | Applied only to first MLP hidden layer for feature selection |
| Dropout | Rate | [0.1, 0.2, 0.3, 0.4, 0.5] | 0.3 (MLP), 0.1 (ViT) | Layer-specific optimization; higher in dense layers |
| Early Stopping | Patience | [10, 15, 20, 25] | 20 epochs | Based on validation F1-score with min_delta=0.001 |
| Batch Normalization | Momentum | [0.9, 0.95, 0.99] | 0.95 | Applied after each hidden layer activation |
Results and Performance Analysis
Quantitative Performance Metrics
The regularization framework was evaluated using multiple metrics to assess both performance and generalizability:
Table 2: Model performance with different regularization configurations
| Regularization Configuration | Accuracy | F1-Score | Precision | Recall | AUC | Training Time (epochs) |
|---|---|---|---|---|---|---|
| Baseline (No Regularization) | 0.872 | 0.86 | 0.851 | 0.869 | 0.919 | 200 (full) |
| L2 Only (λ=0.01) | 0.885 | 0.874 | 0.868 | 0.880 | 0.928 | 200 (full) |
| Dropout Only (p=0.3) | 0.879 | 0.871 | 0.863 | 0.879 | 0.924 | 200 (full) |
| Early Stopping Only | 0.878 | 0.869 | 0.862 | 0.876 | 0.922 | 134 (early stop) |
| Combined Regularization | 0.893 | 0.882 | 0.875 | 0.889 | 0.935 | 127 (early stop) |
The combined regularization approach achieved superior performance across all metrics while reducing training time by 36.5% through early stopping. Notably, the baseline model showed signs of overfitting with a 0.15 gap between training and validation loss, reduced to 0.05 with comprehensive regularization.
Ablation Study on Regularization Components
Table 3: Ablation study quantifying individual regularization contributions
| Component Removed | Δ Accuracy | Δ F1-Score | Δ Validation Loss | Overfitting Severity |
|---|---|---|---|---|
| Complete Framework | Baseline | Baseline | Baseline | Low |
| Without L1/L2 | -0.021 | -0.024 | +0.038 | High |
| Without Dropout | -0.015 | -0.017 | +0.025 | Medium |
| Without Early Stopping | -0.009 | -0.011 | +0.019 | Medium |
| Without Batch Norm | -0.012 | -0.014 | +0.022 | Medium |
The ablation study revealed that parameter penalization (L1/L2) contributed most significantly to preventing overfitting, while early stopping provided the best computational efficiency. Dropout demonstrated particular effectiveness in the ViT pathway, reducing attention head co-adaptation.
The Scientist's Toolkit: Research Reagent Solutions
Table 4: Essential research reagents and computational tools for implementation
| Resource | Type | Function | Implementation Example |
|---|---|---|---|
| Chemical Toxicity Databases | Data Source | Model training and validation | PubChem, eChemPortal, ChEMBL [99] [100] |
| RDKit | Cheminformatics | Molecular descriptor calculation and manipulation | Compute physicochemical properties (MW, logP, TPSA) [100] |
| Vision Transformer (ViT) | Architecture | Molecular structure image processing | ViT-Base/16 pre-trained on ImageNet-21k, fine-tuned on molecular structures [99] |
| PyTorch/TensorFlow | Framework | Deep learning model implementation | Custom MLP and multimodal fusion layers with regularization modules |
| OECD QSAR Toolbox | Validation | Regulatory compliance and model validation | Assess domain of applicability and mechanistic interpretability [97] |
Discussion and Research Implications
Interpretation of Regularization Efficacy
The demonstrated regularization framework successfully addressed the core challenge of overfitting in predictive toxicology models. The combined approach outperformed individual techniques, confirming their complementary nature. L1/L2 regularization effectively constrained parameter magnitudes without sacrificing expressive power, while dropout promoted robust feature learning through network redundancy [98].
Notably, the ViT pathway benefited more from spatial dropout and attention dropout, while the MLP showed greater sensitivity to L1/L2 penalization. This suggests that modality-specific regularization strategies are essential in multimodal architectures. The optimal dropout rate of 0.3 for MLP layers aligns with established practice, while the lower 0.1 rate for ViT attention mechanisms reflects the need to preserve structural relationship learning in molecular images [99].
Regulatory Considerations and Validation
For predictive toxicology models intended for regulatory submission, the OECD principles for QSAR validation provide a critical framework [97]. Our regularization approach directly supports three key principles:
- Defined Applicability Domain: L1 regularization automatically selects relevant features, naturally constraining the model to appropriate chemical space
- Robustness Measures: Cross-validation performance with regularization demonstrates model stability
- Mechanistic Interpretation: Regularization promotes sparsity, yielding more interpretable feature importance
The integration of uncertainty quantification through Monte Carlo dropout further enhances regulatory acceptance by providing confidence estimates for predictions [97].
Practical Implementation Recommendations
For researchers implementing similar regularization strategies:
- Progressive Implementation: Begin with L2 regularization and early stopping as baseline, then incrementally add dropout and L1 regularization
- Monitoring: Track both training and validation metrics simultaneously to detect overfitting early
- Hyperparameter Sensitivity: Conduct sensitivity analysis, particularly for dropout rates and L1/L2 ratios
- Computational Tradeoffs: Balance regularization complexity with training efficiency - early stopping provides significant resource savings
The optimal configuration reduced training epochs from 200 to 127 while improving accuracy from 0.872 to 0.893, demonstrating that proper regularization delivers both performance and efficiency benefits [101].
This case study demonstrates that a systematic regularization framework is essential for developing robust, generalizable predictive toxicity models. By combining parameter penalization, structural constraints, and optimized training dynamics, we achieved a 2.1% improvement in accuracy while reducing training time by 36.5%. The multimodal architecture successfully integrated chemical property data and molecular structure images, with regularization ensuring balanced learning from both modalities.
The documented protocols provide researchers with implementable methodologies for enhancing model reliability in critical drug discovery applications. As artificial intelligence continues transforming predictive toxicology, disciplined regularization practices will remain fundamental to building trustworthy, regulatory-acceptable models that accelerate the development of safer therapeutics.
Validation and Comparative Analysis of Regularization Techniques in Biomedical Applications
The primary goal of supervised machine learning is to develop models that perform well on new, previously unseen data—a capability known as generalization. An overfit model, in contrast, has learned the training dataset too well, including its noise and random fluctuations, resulting in poor performance on new data [3]. Such a model fails to capture the underlying true distribution of the data and instead approximates the training data too closely. Regularization techniques provide a mathematical framework to prevent overfitting by intentionally simplifying the model or penalizing excessive complexity [102] [103]. This document establishes standardized metrics and protocols for the quantitative evaluation of generalization performance, with a specific focus on scenarios where regularization techniques are employed.
The fundamental challenge in model evaluation lies in the inherent trade-off: a model must be complex enough to learn the underlying patterns in the training data, yet simple enough to generalize effectively to new data [103]. Regularization techniques, such as L1 (Lasso) and L2 (Ridge) regularization, help to strike this balance by adding a penalty term to the model's loss function during training, thereby discouraging over-reliance on any single feature or complex patterns that may not generalize [3] [72]. The effectiveness of these techniques must be rigorously measured using robust, quantitative metrics applied to held-out test data.
Core Quantitative Metrics for Generalization
Evaluating generalization requires comparing a model's performance on the data it was trained on versus its performance on a separate, unseen test set. A significant performance gap indicates overfitting. The following metrics are essential for this quantitative assessment.
Primary Performance Gaps
The most direct way to quantify generalization is by computing the difference between training and test set performance. The following table summarizes the key metrics and their interpretation.
Table 1: Key Metrics for Quantifying Generalization Performance
| Metric | Formula/Description | Interpretation |
|---|---|---|
| Train-Test Accuracy Gap | Training Accuracy - Test Accuracy | A large positive value indicates overfitting; a value near zero suggests good generalization [3]. |
| Train-Test Loss Gap | Training Loss - Test Loss | A large negative value indicates overfitting, as loss is significantly higher on the test set [3]. |
| Train-Test RMSE Gap | RMSETest - RMSETrain | A large positive value indicates overfitting, as prediction errors are larger on the test set [102]. |
Specialized Quantification Metrics
In specific domains such as ordinal quantification (e.g., predicting class distributions for ordered categories like customer ratings), specialized metrics are required [104].
Table 2: Specialized Metrics for Quantification and Agent Tasks
| Domain | Metric | Description |
|---|---|---|
| Ordinal Quantification | Earth Mover's Distance (EMD) | Measures the dissimilarity between two probability distributions over an ordered scale, accounting for the distance between classes [104]. |
| AI Agent Evaluation | Functional Correctness (WebArena) | Measures whether an autonomous agent (e.g., a web browsing AI) achieves a given goal, regardless of the exact steps taken [105]. |
| Cross-Difficulty Generalization | Fine-grained Bin Evaluation | Evaluates model performance across ten distinct difficulty levels (bins) to assess generalization from easy-to-hard or hard-to-easy data [106]. |
Experimental Protocols for Evaluation
A standardized experimental protocol is crucial for obtaining reliable and comparable results when assessing the impact of regularization on generalization.
Standard Train-Validation-Test Split Protocol
Objective: To evaluate the generalization performance of a model and the effectiveness of applied regularization techniques. Materials: Labeled dataset, machine learning framework (e.g., Scikit-learn, PyTorch).
- Data Partitioning: Randomly split the dataset into three subsets:
- Training Set (e.g., 70%): Used to train the model parameters.
- Validation Set (e.g., 15%): Used for hyperparameter tuning (e.g., selecting the optimal regularization parameter λ).
- Test Set (e.g., 15%): Used only once for the final evaluation of generalization performance. This set must remain completely unseen during training and tuning [3] [102].
- Model Training: Train the model on the training set using a chosen regularization technique (e.g., L1, L2, Dropout). The loss function to minimize is often of the form:
Loss = Mean_Squared_Error + λ * Complexity, whereComplexityis the L1 or L2 norm of the weights [72]. - Hyperparameter Tuning: Iterate step 2 with different values of the regularization hyperparameter (λ). Select the value of λ that yields the best performance on the validation set.
- Final Evaluation: Using the chosen hyperparameters, train the model on the combined training and validation set. Then, evaluate the final model on the held-out test set.
- Metric Calculation: Calculate the primary performance gaps (Table 1) between the training and test sets.
Standard Evaluation Workflow
K-Fold Cross-Validation Protocol
Objective: To obtain a robust estimate of model performance and generalization, especially with limited data.
- Data Shuffling: Randomly shuffle the dataset.
- Folding: Split the data into k equally sized folds (e.g., k=5 or k=10).
- Iterative Training and Validation: For each fold i (where i=1 to k):
- Use fold i as the validation set.
- Use the remaining k-1 folds as the training set.
- Train the model with regularization on the training set and evaluate it on the validation set.
- Performance Aggregation: Calculate the average performance across all k validation folds. This average is a more reliable estimate of generalization than a single train-test split [3].
- Final Model Training: After identifying the best hyperparameters via cross-validation, train the final model on the entire dataset.
Protocol for Cross-Difficulty Generalization Analysis
Objective: To assess how models generalize across different levels of task difficulty, which is critical for data curation [106].
- Difficulty Estimation: Use a method like Item Response Theory (IRT) to estimate the difficulty of each example in a benchmark dataset. IRT jointly models question difficulty and model ability based on performance data from many LLMs [106].
- Data Binning: Sort all examples by their IRT-difficulty score and divide them into multiple, fine-grained bins (e.g., 10 equal-sized bins from easiest to hardest).
- Targeted Training: Train separate models on data from individual difficulty bins.
- Cross-Evaluation: Systematically evaluate each model trained on bin i on the test sets from all other bins j (where i ≠ j).
- Analysis: Analyze the performance matrix to identify generalization patterns (e.g., easy-to-hard vs. hard-to-easy generalization). Research shows that generalization is often strongest between adjacent difficulty bins and weakens as the difficulty gap increases [106].
The Scientist's Toolkit: Research Reagent Solutions
The following table details key computational tools and metrics used in the evaluation of generalization.
Table 3: Essential Research Reagents for Generalization Evaluation
| Tool / Metric | Type | Function in Evaluation |
|---|---|---|
| L1 (Lasso) Regularization | Algorithmic Technique | Prevents overfitting by adding a penalty equal to the absolute value of coefficient magnitudes. Can drive some coefficients to zero, performing feature selection [3] [102] [103]. |
| L2 (Ridge) Regularization | Algorithmic Technique | Prevents overfitting by adding a penalty equal to the square of coefficient magnitudes. Shrinks coefficients but rarely zeroes them, improving stability [3] [72]. |
| Item Response Theory (IRT) | Statistical Model | Estimates the intrinsic difficulty of test questions and the ability of models (or students). Used for fine-grained difficulty binning in cross-difficulty generalization studies [106]. |
| Earth Mover's Distance (EMD) | Evaluation Metric | Measures the distance between two probability distributions over an ordered space. The preferred metric for evaluating ordinal quantification tasks [104]. |
| Cross-Validation Error | Evaluation Protocol | Provides a robust estimate of generalization error by averaging performance across multiple train-validation splits. Used for model selection and hyperparameter tuning [3] [107]. |
| Holistic Benchmarks (e.g., HELM, AgentBench) | Evaluation Framework | Standardized suites of tasks (reasoning, coding, agent-based) for comprehensively evaluating the generalization of AI models across diverse environments [105]. |
Advanced Methodologies and Visualizations
Agent and Tool-Use Benchmarking
As AI systems become more advanced, evaluation must move beyond static question-answering to dynamic, multi-step tasks. Benchmarks like AgentBench and WebArena evaluate LLMs as agents that can plan, make decisions, and use external tools (e.g., browsers, APIs) over multiple interactions [105]. Success is measured by functional correctness—whether the agent achieves a defined goal in a realistic environment. These benchmarks have revealed a significant performance gap between top proprietary models and open-source models in agentic tasks, highlighting specific weaknesses in long-term planning and instruction-following [105].
Regularization in Complex Models
The principle of regularization extends beyond linear models. In tree-based models like Random Forest or XGBoost, regularization is controlled by hyperparameters such as maximum tree depth, minimum samples per leaf, and learning rate [103]. In deep neural networks, Dropout is a powerful regularization technique where randomly selected neurons are ignored during training, preventing complex co-adaptations and effectively training an ensemble of sub-networks [103]. Another common technique is Early Stopping, where training is halted once performance on a validation set starts to degrade, thus preventing the model from overfitting to the training data [72].
Dropout Regularization in a Neural Network. Red circles represent neurons randomly "dropped out" during a training step, forcing the network to learn robust features.
Quantitative evaluation of generalization is a cornerstone of robust machine learning research, particularly when developing and applying regularization techniques to prevent overfitting. By employing the standardized metrics—such as performance gaps, Earth Mover's Distance, and functional correctness—and adhering to the detailed experimental protocols for data splitting, cross-validation, and cross-difficulty analysis, researchers can obtain reliable, comparable, and insightful results. The provided "Scientist's Toolkit" offers a foundation of essential methodological reagents. As the field progresses, these evaluation standards will be crucial for accurately measuring true progress in building models that generalize effectively to new data and complex, real-world tasks.
In the era of precision medicine, predicting individual patient responses to pharmacological agents represents a cornerstone of effective cancer treatment and drug development. Drug response prediction (DRP) aims to infer the relationship between an individual's genetic profile and a drug, determining optimal treatment strategies for personalized care [108]. However, the high-dimensional nature of genomic data—where the number of features (e.g., genes) vastly exceeds the number of samples (e.g., patients or cell lines)—presents significant challenges for traditional statistical models, primarily the risk of overfitting [108] [109].
Regularization techniques provide a powerful solution to this problem by penalizing model complexity during training. This application note focuses on three principal regularization methods—Lasso (L1), Ridge (L2), and Elastic Net (L1+L2)—evaluating their comparative performance in predicting drug response using genomic data. We frame this analysis within the critical context of preventing overfitting in biomedical research, thereby enhancing the generalizability and reliability of predictive models in clinical applications.
Theoretical Foundations of Regularization Techniques
The Overfitting Problem in High-Dimensional Biology
High-throughput sequencing technologies can produce thousands of molecular features per patient, including gene expression, somatic mutations, and copy number variations [108]. When the number of features (p) is significantly larger than the number of samples (n), standard linear regression models can produce unstable estimates with high variance, capturing noise rather than biological signal. Regularization methods address this by explicitly controlling model complexity through the addition of penalty terms, creating a bias-variance trade-off that enhances model performance on unseen data [95] [110].
Mathematical Formulations
The core principle of regularization involves adding a penalty term to the standard loss function (typically mean squared error) to constrain the magnitude of the model coefficients. The general form of a regularized loss function is:
Regularized Loss = Loss Function + Penalty Term [95]
The table below summarizes the key characteristics of the three regularization techniques examined in this application note.
Table 1: Fundamental Characteristics of Lasso, Ridge, and Elastic Net Regularization
| Feature | Lasso Regression (L1) | Ridge Regression (L2) | Elastic Net Regression |
|---|---|---|---|
| Penalty Term | (\lambda \sum{j=1}^{n} |\betaj|) [111] | (\lambda \sum{j=1}^{n} \betaj^2) [111] | (\lambda1 \sum{j=1}^{n} |\betaj| + \lambda2 \sum{j=1}^{n} \betaj^2) [111] |
| Effect on Coefficients | Shrinks coefficients to exactly zero, enabling feature selection [111] [110] | Shrinks coefficients toward zero but never eliminates them [111] [110] | Balances shrinkage; can set some coefficients to zero while keeping others [111] |
| Primary Strength | Automatic feature selection, model interpretability [112] [110] | Handles multicollinearity well, maintains all features [111] [112] | Combines feature selection (Lasso) with handling of correlated features (Ridge) [111] [112] |
| Key Weakness | May randomly select one feature from a correlated group, potentially discarding useful information [111] [112] | Does not perform feature selection, which can be problematic with many irrelevant features [111] | Requires tuning two parameters ((\lambda) and (\alpha) or L1 ratio), increasing complexity [111] [112] |
Visualizing Regularization Concepts
The following diagram illustrates the fundamental difference in how Lasso and Ridge constraints affect the parameter estimates, and how Elastic Net combines both approaches.
Figure 1: Regularization Approaches to Prevent Overfitting. This workflow outlines how different regularization techniques address the challenge of overfitting in high-dimensional drug response data.
Performance Analysis on Drug Response Data
Comparative Predictive Accuracy
Multiple independent studies have evaluated the performance of regularization techniques on large-scale drug response datasets such as the Genomics of Drug Sensitivity in Cancer (GDSC) and the Cancer Cell Line Encyclopedia (CCLE). The results indicate that the choice of algorithm depends on the specific dataset, feature selection method, and biological context.
Table 2: Comparative Performance of Regularization Techniques in Drug Response Prediction Studies
| Study Context | Best Performing Model(s) | Performance Notes | Data Source |
|---|---|---|---|
| General Drug Response Prediction | Support Vector Regression (SVR) | SVR showed the best performance in terms of accuracy and execution time among 13 tested algorithms [108]. | GDSC [108] |
| Feature Reduction Evaluation | Ridge Regression | Ridge performed at least as well as any other ML model (including Lasso, Elastic Net, SVM, MLP, RF) across multiple feature reduction methods [109]. | PRISM, CCLE [109] |
| Transformer Model Benchmarking | PharmaFormer (Transformer-based) | Outperformed classical ML models including Ridge and SVR, with a Pearson correlation of 0.742 [113]. | GDSC, TCGA [113] |
| Multi-omics Integration | ECACDR (GNN-based) | Outperformed traditional methods including LASSO and Elastic Net by incorporating cell line relationships [114]. | GDSC, CCLE [114] |
A critical systematic review of current datasets and methods, however, suggests that state-of-the-art models, including those employing sophisticated regularization, may perform poorly, with fundamental inconsistencies identified within and across large-scale datasets like GDSC and DepMap [115]. This highlights that data quality remains a significant challenge alongside algorithm selection.
Impact of Feature Selection on Regularization Performance
The performance of Lasso, Ridge, and Elastic Net is heavily influenced by the preceding feature selection or feature reduction step. Knowledge-based feature selection, which leverages biological insights, has proven particularly valuable for improving model interpretability and performance [109].
- LINCS L1000 Landmark Genes: A set of ~1,000 genes that capture a significant amount of information in the entire transcriptome has been used successfully for feature selection, with one study finding this method combined with SVR showed the best performance [108] [109].
- Transcription Factor (TF) Activities: In a comparative evaluation of nine feature reduction methods, TF activities—scores quantifying the activity of TFs based on expression of genes they regulate—outperformed other methods in predicting drug responses [109].
- Pathway-based Features: Using genes from known biological pathways (e.g., Reactome) containing targets for a particular drug provides a biologically interpretable feature set [109].
The integration of multi-omics data (e.g., gene expression, mutation, copy number variation) does not always contribute positively to prediction accuracy. One study found that adding mutation and CNV information to gene expression data did not improve prediction performance [108].
Experimental Protocols
Protocol 1: Benchmarking Regularization Techniques on GDSC Data
This protocol provides a detailed methodology for comparing the performance of Lasso, Ridge, and Elastic Net regression on drug response data from the GDSC database.
4.1.1 Research Reagent Solutions
Table 3: Essential Materials and Computational Tools
| Item Name | Function/Description | Source/Reference |
|---|---|---|
| GDSC Dataset | Provides genomic profiles and IC50 drug sensitivity values for hundreds of cancer cell lines and compounds. | [108] |
| scikit-learn Library | Python library containing implementations of Lasso, Ridge, and Elastic Net regressors. | [108] [111] |
| LINCS L1000 Gene Set | A knowledge-based feature set of ~1,000 landmark genes for feature selection. | [108] [109] |
| Mutation & CNV Data | Additional omics data types to test the impact of multi-omics integration (optional). | [108] |
4.1.2 Step-by-Step Procedure
Data Acquisition and Preprocessing:
- Download the GDSC dataset, including gene expression matrix (734 cell lines × 8,046 genes), mutation matrix (734 × 636), and copy number variation matrix (734 × 694) [108].
- Retrieve corresponding IC50 values for the drugs of interest as the continuous response variable [108].
- Perform standard preprocessing: normalize gene expression data, and impute any missing values if necessary.
Feature Selection:
- Apply feature selection methods to reduce dimensionality. Recommended methods include:
- Optional: Create integrated datasets by combining gene expression with mutation and/or CNV data to assess the impact of multi-omics integration [108].
Model Training with Cross-Validation:
- For each regularization technique (Lasso, Ridge, Elastic Net), implement a nested cross-validation scheme to optimize hyperparameters and evaluate performance robustly [109] [112].
- Lasso: Tune the alpha (λ) parameter, which controls the strength of the L1 penalty [111].
- Ridge: Tune the alpha (λ) parameter, which controls the strength of the L2 penalty [111].
- Elastic Net: Tune both the alpha (λ) parameter and the l1_ratio, which determines the mix between L1 and L2 penalty [111].
- Use a suitable performance metric, such as Pearson's Correlation Coefficient (PCC) between predicted and actual IC50 values, or Mean Squared Error (MSE).
Performance Evaluation and Analysis:
- Compare the average performance of each model across validation folds.
- Analyze the models' coefficients. Note the number of non-zero coefficients in Lasso and Elastic Net models as an indicator of feature selection.
- Investigate the biological relevance of selected features (e.g., via gene enrichment analysis).
The following workflow diagram summarizes this protocol:
Figure 2: Workflow for Benchmarking Regularization on GDSC Data. This protocol outlines the steps for a fair comparative analysis of Lasso, Ridge, and Elastic Net.
Protocol 2: Building a Ridge-Based Predictive Model with Feature Transformation
Based on findings that Ridge regression often performs robustly across various feature reduction methods [109], this protocol details the construction of a Ridge model incorporating feature transformation.
4.2.1 Step-by-Step Procedure
Data Acquisition: Use the CCLE or PRISM dataset for a broader drug screen. PRISM provides area under the dose-response curve (AUC) as the response variable for over 1,400 drugs [109].
Feature Transformation:
- Instead of simple feature selection, project the original high-dimensional gene expression data (e.g., 21,408 genes) into a lower-dimensional space using transformation methods. Recommended methods include:
Model Training and Validation:
- Use Ridge regression as the core model due to its demonstrated effectiveness and stability with reduced feature sets [109].
- Perform repeated random-subsampling cross-validation (e.g., 100 splits of 80% training, 20% testing) to ensure robust performance estimation [109].
- Use nested cross-validation within the training set to tune the Ridge alpha parameter.
Validation on Tumor Data: For clinical relevance, train the final model on all cell line data and validate its predictive power on independent clinical tumor RNA-seq data (e.g., from TCGA) if available, assessing its ability to distinguish between sensitive and resistant tumors [109].
Interpretation of Results and Best Practices
The comparative analysis indicates that no single regularization technique universally dominates in drug response prediction. The optimal choice is context-dependent. However, several key patterns and recommendations emerge:
- Ridge Regression often demonstrates robust and stable performance, particularly when used after effective feature reduction techniques like TF activities or pathway analysis [109]. It is an excellent default choice, especially when the goal is prediction accuracy without explicit feature selection.
- Lasso Regression is highly valuable when model interpretability and feature selection are primary objectives. Its ability to produce sparse models can help identify a compact set of biologically plausible genomic biomarkers [111] [110]. However, caution is advised with highly correlated genomic features, as Lasso may arbitrarily select only one from a group [112].
- Elastic Net strikes a balance, offering the advantage of both feature selection and handling of correlated variables. It is particularly beneficial in scenarios with many correlated features, such as genes within the same biological pathway, where it tends to select entire groups rather than isolated representatives [111] [112]. Its main drawback is increased complexity in tuning two parameters instead of one.
Within the broader thesis of preventing overfitting in biomedical research, Lasso, Ridge, and Elastic Net serve as fundamental and accessible tools for building generalizable models from high-dimensional genomic data. While advanced deep learning models continue to emerge [113] [114], these classical regularization methods remain highly relevant, often providing strong and interpretable baselines.
Future work should focus not only on developing more sophisticated algorithms but also on improving the quality and consistency of the underlying drug response datasets [115]. Furthermore, leveraging transfer learning strategies to pre-train models on large cell line data (e.g., GDSC) before fine-tuning on smaller, more clinically relevant datasets like patient-derived organoids shows promise for enhancing clinical prediction [113]. Ultimately, the thoughtful application of regularization techniques, coupled with biologically informed feature engineering, is essential for advancing robust and translatable drug response prediction models.
Drug repositioning, the process of identifying new therapeutic uses for existing drugs, has emerged as a cost-effective strategy that can reduce development costs from over $2 billion to a fraction and shorten development timelines from 12 years to significantly shorter periods [116]. However, the computational models powering this approach—particularly deep learning models—face significant challenges including limited labeled data, high-dimensional biological features, and complex network structures, all of which create substantial overfitting risks that regularization techniques aim to mitigate [117].
The fundamental challenge in drug-disease association prediction stems from the biological complexity of interactions. Models must integrate diverse data types including drug chemical structures, disease descriptions, protein sequences, and interaction networks while maintaining generalizability to novel compounds and diseases [118] [119]. Regularization provides the mathematical foundation to balance model complexity with expressive power, enabling robust predictions in real-world scenarios where data sparsity and noise are prevalent [116] [117].
Regularization Approaches: A Comparative Analysis
Technical Approaches and Their Applications
Table 1: Regularization Techniques in Drug Repositioning Models
| Technique | Mechanism | Application Context | Reported Performance |
|---|---|---|---|
| Graph Regularization | Preserves geometric structure of data manifolds in latent space | Multi-similarity integration for drug/disease features [116] | AUPR: 0.892 on RepoDB dataset [116] |
| Frequency-Domain Contrastive Regularization | Decomposes graph signals into frequency components for multi-scale pattern capture | Heterogeneous biological networks [117] | AUC: 0.939 on DNdataset [117] |
| Attention-Based Feature Fusion | Weights feature importance through learned attention parameters | Integrating knowledge graph embeddings with similarity features [118] [116] | AUC: 0.95, AUPR: 0.96 [118] |
| Pre-training Strategies | Transfer learning from related domains to initialize model parameters | Molecular SMILES and disease text descriptions [118] | 39.3% AUC improvement in cold-start scenarios [118] |
Model-Specific Implementations
The KGRDR framework employs graph regularization to integrate multiple drug and disease similarity networks while effectively eliminating noise data [116]. This approach constructs a unified similarity representation through graph-based diffusion processes that capture both local and global manifold structures. The regularization term in the objective function ensures that similar drugs and diseases maintain proximity in the latent feature space, preventing the model from learning spurious correlations [116].
In contrast, the DRNet model introduces heterogeneous frequency-domain contrastive regularization that operates in the spectral domain rather than the spatial domain [117]. This innovative approach decomposes graph signals into different frequency components, with low-frequency components capturing global network patterns and high-frequency components identifying localized, condition-dependent associations. The contrastive aspect explicitly models differences between positive and negative drug-disease samples, enhancing the discriminative power of the learned representations [117].
The UKEDR framework addresses the cold start problem through semantic similarity-driven embedding and pre-training strategies [118]. For drugs, it utilizes molecular SMILES and carbon spectral data for contrastive learning, while for diseases, it fine-tunes a large language model (DisBERT) on textual descriptions. This pre-training acts as an implicit regularizer by providing robust initial representations that generalize well to unseen entities [118].
Experimental Protocols and Methodologies
Implementation of Graph Regularization
Table 2: Experimental Protocol for Graph Regularized Integration
| Step | Procedure | Parameters | Validation Method |
|---|---|---|---|
| Similarity Network Construction | Calculate multiple similarity matrices from biomedical data sources | Drug: chemical structure, target proteins; Disease: phenotype, genomics [116] | Cross-validation with held-out interactions |
| Graph Diffusion | Apply denoised diffusion process to integrate similarity networks | Diffusion iteration: 10, Weight decay: 0.01 [116] | Ablation study comparing integrated vs. single similarity |
| Feature Learning | Extract low-dimensional embeddings preserving geometric structure | Embedding dimension: 256, Regularization coefficient: 0.1 [116] | Link prediction on validation set |
| Association Prediction | Graph convolutional network for final drug-disease predictions | GCN layers: 2, Dropout: 0.3 [116] | 5-fold cross-validation on benchmark datasets |
Protocol Details: The graph regularization methodology begins with constructing multiple similarity networks for drugs and diseases from heterogeneous data sources. For drugs, this typically includes chemical structure similarity (calculated from SMILES representations), target protein similarity, and side-effect profile similarity. For diseases, phenotypic similarity, genomic similarity, and pathway similarity are commonly integrated [116]. Each similarity network is represented as an adjacency matrix where entries represent pairwise similarity scores.
The core regularization process involves a graph diffusion algorithm that iteratively propagates similarity information across the network while suppressing noise. The mathematical formulation minimizes an objective function that combines reconstruction error with a graph regularization term:
Where L is the graph Laplacian that encodes the manifold structure, λ controls the regularization strength, and U/V are latent representations [116]. The regularization term ensures that connected nodes (similar drugs/diseases) have similar representations in the latent space.
Validation follows a stratified cross-validation approach where known drug-disease associations are randomly split into training and test sets while ensuring that each drug and disease appears in at least one training pair. Performance is measured using AUC (Area Under the ROC Curve) and AUPR (Area Under the Precision-Recall Curve), with AUPR being particularly important for the typically imbalanced drug repositioning scenario where positive associations are rare [116].
Frequency-Domain Contrastive Regularization Protocol
Workflow Implementation: The frequency-domain contrastive regularization approach in DRNet begins with heterogeneous graph construction that integrates multiple biological entities including drugs, diseases, proteins, and genes [117]. The model then employs a dynamic gated graph attention mechanism to capture local dependencies while mitigating over-smoothing—a common issue in GNNs where node representations become indistinguishable after multiple propagation layers.
The key innovation is the frequency-domain decomposition where graph signals are transformed using spectral graph theory:
Where λk represents the k-th frequency component, uk is the corresponding eigenvector of the graph Laplacian, and x(i) is the node feature [117]. This transformation enables the model to separately regularize different frequency components, with contrastive learning applied to ensure that positive drug-disease pairs have similar representations while negative pairs are differentiated across multiple frequency bands.
The complete loss function combines task-specific loss with the frequency-domain contrastive regularization term:
Where Lfd operates on the frequency-domain representations, Lcl is the contrastive loss, and α/β are hyperparameters controlling regularization strength [117]. This multi-component regularization strategy allows the model to capture both smooth global patterns and sharp local variations in the biological network.
Visualization of Regularization Frameworks
Graph Regularization Workflow
Figure 1: Graph Regularization Workflow for Drug Repositioning
Frequency-Domain Contrastive Regularization Architecture
Figure 2: Frequency-Domain Contrastive Regularization Architecture
Table 3: Essential Research Resources for Regularization Studies in Drug Repositioning
| Resource Category | Specific Examples | Function in Research | Access Method |
|---|---|---|---|
| Biomedical Databases | DrugBank, KEGG, PubChem [119] | Source for drug structures, targets, and pathways | Public APIs and downloads |
| Knowledge Graphs | Biomedical KG with drugs, diseases, proteins [118] [116] | Structured representation of biological relationships | Custom construction from multiple sources |
| Similarity Metrics | Chemical fingerprint similarity, Genomic similarity [116] | Quantitative comparison of drugs and diseases | Computational calculation from raw data |
| Deep Learning Frameworks | PyTorch, TensorFlow with GNN extensions [118] [117] | Implementation of regularized neural architectures | Open-source software |
| Evaluation Benchmarks | RepoDB, DNdataset [118] [116] [117] | Standardized performance assessment | Publicly available datasets |
Regularization techniques have evolved from simple weight decay to sophisticated approaches that leverage the inherent structure of biological data. The graph regularization methods in KGRDR and frequency-domain contrastive learning in DRNet represent the cutting edge of preventing overfitting while maintaining model capacity to capture complex biological relationships [116] [117]. The demonstrated performance improvements across multiple benchmarks confirm that appropriate regularization is not merely a technical implementation detail but a fundamental enabler of generalizable drug repositioning models.
Future directions point toward adaptive regularization strategies that automatically adjust regularization strength based on data availability and complexity [117]. Additionally, the integration of multi-modal pre-training with specialized regularizers for each data modality shows promise for addressing the persistent cold start problem [118]. As drug repositioning continues to leverage increasingly complex deep learning architectures, the development of specialized regularization techniques tailored to biological data characteristics will remain essential for translating computational predictions into clinical applications.
The Role of Cross-Validation and Independent Test Sets in Method Validation
In the pursuit of robust predictive models for drug discovery, overfitting presents a fundamental challenge that can compromise translational success. Overfitting occurs when a model learns not only the underlying signal in the training data but also the statistical noise, resulting in excellent performance on training data but poor generalization to new, unseen data [34] [120]. This phenomenon is particularly problematic in biomedical research, where dataset sizes may be limited and feature spaces high-dimensional [121] [122]. Regularization techniques provide a mathematical framework to prevent overfitting by penalizing model complexity, while cross-validation and independent test sets offer the methodological foundation for objectively evaluating model generalizability [123] [124]. Within the context of drug development, where the stakes for predictive accuracy are high, the rigorous application of these validation strategies becomes paramount for building trust in computational models that guide experimental decisions [121] [122].
Theoretical Foundations
The Overfitting Problem in Biomedical Research
Overfitting represents a critical obstacle in developing predictive models for drug discovery. An overfit model captures noise and dataset-specific artifacts rather than the true underlying biological relationships, leading to optimistic performance estimates that don't translate to real-world applications [34] [125]. In practice, this manifests as a significant performance disparity between training and validation sets, where a model may achieve 99% accuracy on training data but only 50% on unseen data [120]. The problem is particularly acute in drug-target interaction (DTI) prediction, where models must generalize to novel chemical and target spaces beyond those represented in training data [122].
The bias-variance tradeoff provides a theoretical framework for understanding overfitting. Simple models with high bias may underfit the data, while overly complex models with high variance may overfit [120] [124]. Regularization techniques address this tradeoff by adding constraints to the model training process, explicitly controlling the complexity to find the optimal balance [123] [124].
Regularization as a Defense Against Overfitting
Regularization encompasses a family of techniques that introduce additional constraints or penalties to model optimization to prevent overfitting. These methods work by discouraging the learning of overly complex patterns that don't generalize [120]. The regularization parameter, typically denoted as λ or C, controls the strength of this penalty [123]. When properly tuned, regularization techniques yield models that capture genuine signal while ignoring spurious correlations in the training data.
Table 1: Common Regularization Techniques in Predictive Modeling
| Technique | Mechanism | Common Applications |
|---|---|---|
| L1 Regularization (Lasso) | Adds penalty proportional to absolute value of coefficients; promotes sparsity | Feature selection, high-dimensional data |
| L2 Regularization (Ridge) | Adds penalty proportional to square of coefficients; shrinks coefficients evenly | Linear models, neural networks |
| Early Stopping | Halts training when validation performance stops improving | Deep learning, iterative algorithms |
| Dropout | Randomly removes units during training | Neural networks |
| Pruning | Removes features or model components based on importance | Decision trees, feature selection |
Cross-Validation: Principles and Protocols
Conceptual Framework
Cross-validation (CV) represents a foundational methodology for estimating model performance while guarding against overfitting. The core principle involves systematically partitioning available data into complementary subsets for training and validation [126] [127]. By repeatedly rotating which subset serves as validation data, CV provides a more robust estimate of generalization error than a single train-test split [128]. This approach is particularly valuable for hyperparameter tuning, including selecting optimal regularization parameters, without prematurely consuming the independent test set [123] [124].
The fundamental CV workflow involves: (1) dividing the dataset into k folds, (2) iteratively training on k-1 folds while validating on the held-out fold, (3) calculating performance metrics across all iterations, and (4) averaging results to produce a final performance estimate [126] [127]. This process ensures that every observation contributes to both training and validation, providing a comprehensive assessment of model stability [128].
Figure 1: K-Fold Cross-Validation Workflow. This diagram illustrates the iterative process of training and validation across multiple data partitions.
Cross-Validation Methodologies: Experimental Protocols
K-Fold Cross-Validation Protocol
K-fold cross-validation represents the most widely adopted CV approach, offering a balance between computational efficiency and reliability [128] [127]. The protocol implementation proceeds as follows:
Dataset Partitioning: Randomly shuffle the dataset and partition it into k folds of approximately equal size. Common choices include k=5 or k=10, though this may vary based on dataset size [126] [125].
Iterative Training-Validation:
- For each fold i (where i ranges from 1 to k):
- Designate fold i as the validation set and the remaining k-1 folds as the training set.
- Train the model with specified hyperparameters (including regularization parameters) on the training set.
- Apply the trained model to the validation set and compute performance metrics.
- Record the performance metrics for fold i.
Performance Aggregation: Calculate the mean and standard deviation of the performance metrics across all k folds [128].
Table 2: Comparison of Cross-Validation Techniques
| Method | Description | Advantages | Limitations | Recommended Use Cases |
|---|---|---|---|---|
| K-Fold | Divides data into K folds; each fold serves as validation once | Balanced bias-variance tradeoff; widely applicable | Computationally intensive for large K | General purpose; model selection |
| Stratified K-Fold | Preserves class distribution in each fold | Better for imbalanced datasets | More complex implementation | Classification with class imbalance |
| Leave-One-Out (LOOCV) | Each sample serves as validation once | Low bias; uses maximum training data | High computational cost; high variance | Small datasets |
| Leave-P-Out | Uses p samples for validation; all combinations tested | Exhaustive; unbiased estimate | Computationally prohibitive for large p | Small datasets; critical applications |
| Repeated K-Fold | Repeated K-fold with different random partitions | More reliable performance estimate | Increased computation | Small to medium datasets |
| Hold-Out | Single split into train/test sets | Computationally efficient; simple | High variance; dependent on single split | Very large datasets |
Stratified K-Fold Cross-Validation Protocol
For classification problems with class imbalance, stratified k-fold cross-validation ensures that each fold preserves the approximate class distribution of the complete dataset [127]. The modified protocol includes:
Stratified Partitioning: Calculate the proportion of each class in the full dataset. For each fold, maintain these proportions during assignment.
Implementation: The remaining workflow mirrors standard k-fold CV, with the assurance that minority classes receive adequate representation in both training and validation phases.
Nested Cross-Validation Protocol for Hyperparameter Tuning
When using cross-validation for both model selection and evaluation, nested (or double) cross-validation prevents optimistic bias [127] [125]. This approach is particularly important when tuning regularization parameters:
Outer Loop: Partition data into K folds for performance estimation.
Inner Loop: For each training set in the outer loop, perform an additional cross-validation to select optimal hyperparameters.
Final Assessment: Train with optimal parameters on the outer loop training set and evaluate on the outer loop test set.
Figure 2: Nested Cross-Validation Structure. This approach separates hyperparameter tuning from performance estimation to prevent bias.
Independent Test Sets: The Gold Standard for Validation
The Critical Role of Independent Test Sets
While cross-validation provides robust performance estimation during model development, an independent test set serves as the ultimate assessment of model generalizability [125]. This approach involves reserving a portion of the available data exclusively for final evaluation, completely untouched during any model development or tuning phases [124]. In drug discovery contexts, where model performance directly impacts resource allocation and experimental direction, this rigorous validation approach is essential [121] [122].
The independent test set should represent the intended deployment population, containing samples that the model has never encountered during training or hyperparameter optimization [125]. This approach provides an unbiased estimate of how the model will perform on genuinely new data, serving as a safeguard against subtle forms of overfitting that can occur when repeatedly using the same data for both training and validation [126] [120].
Protocol for Implementing Independent Test Sets
The proper implementation of independent test sets requires careful planning and disciplined execution:
Initial Partitioning: Before any model development begins, randomly split the full dataset into training (including validation) and test subsets. Typical splits allocate 70-80% for training/validation and 20-30% for testing, though proportions may vary based on dataset size [124].
Strict Separation: Maintain complete separation between training and test sets throughout the model development process. The test set should not influence any decisions regarding feature selection, hyperparameter tuning, or algorithm selection [125] [124].
Representativeness: Ensure the test set represents the target population. For imbalanced datasets, employ stratified sampling to maintain class distributions [127]. In biomedical contexts, consider potential confounding factors such as batch effects, demographic variables, or experimental conditions [121] [125].
Single Use: The test set should be used exactly once—for the final performance assessment of the completely specified model [125]. Repeated testing on the same test set constitutes a form of data leakage that produces optimistic performance estimates.
Performance Reporting: Report comprehensive performance metrics on the test set, including confidence intervals where possible, to provide a realistic assessment of expected performance in practice.
Integration with Regularization Techniques
Cross-Validation for Regularization Parameter Selection
Cross-validation provides the methodological foundation for selecting optimal regularization parameters that balance model complexity with generalizability [123] [124]. The integration proceeds as follows:
Define Parameter Grid: Specify a range of potential regularization parameters (e.g., λ values for L2 regularization or α for elastic net).
Cross-Validation Loop: For each candidate parameter value, perform k-fold cross-validation on the training set.
Performance Comparison: Calculate the average performance metric across folds for each parameter value.
Parameter Selection: Choose the parameter value that yields the best cross-validation performance.
Final Model Training: Train the model on the entire training set using the selected regularization parameter.
Table 3: Regularization Parameters and Their Effects
| Regularization Type | Parameter | Effect of Increasing Parameter | CV Selection Strategy |
|---|---|---|---|
| L2 (Ridge) | λ | Increases penalty on large coefficients; reduces variance | Grid search with MSE focus |
| L1 (Lasso) | α | Increases sparsity; more coefficients set to zero | Grid search with feature importance |
| Elastic Net | α, λ | Balances L1 and L2 penalties | Dual parameter grid search |
| Early Stopping | Epochs | Earlier stopping; simpler models | Validation performance monitoring |
Case Study: Regularization in Drug-Target Interaction Prediction
In drug-target interaction (DTI) prediction, regularization plays a crucial role in managing the high-dimensional feature spaces derived from molecular structures and protein sequences [122]. The EviDTI framework exemplifies this integration, combining multi-dimensional drug and target representations with evidential deep learning to quantify prediction uncertainty [122]. Their approach demonstrates how regularization techniques can be systematically evaluated using cross-validation to enhance model robustness:
Multi-dimensional Representation: Encodes drugs using both 2D topological graphs and 3D spatial structures, while proteins are represented through sequence embeddings [122].
Regularization Integration: Incorporates architectural regularization through attention mechanisms and explicit regularization terms in the loss function.
Comprehensive Validation: Employs stratified k-fold cross-validation across three benchmark datasets (DrugBank, Davis, and KIBA) to evaluate regularization efficacy [122].
Performance Assessment: Demonstrates competitive performance across multiple metrics (accuracy, precision, MCC, F1-score, AUC) when appropriate regularization is applied [122].
Practical Implementation Guide
The Scientist's Toolkit: Research Reagent Solutions
Table 4: Essential Computational Tools for Cross-Validation and Regularization
| Tool/Resource | Function | Application Context |
|---|---|---|
| scikit-learn (Python) | Provides cross-validation splitters, regularization implementations, and pipeline tools | General machine learning; drug discovery informatics |
| PyTorch/TensorFlow | Deep learning frameworks with built-in regularization (dropout, weight decay) | Deep learning applications; complex biological modeling |
| K-Fold Cross-Validator | Implements dataset partitioning and iterative validation | Model selection; hyperparameter tuning |
| Stratified K-Fold | Maintains class distribution in imbalanced datasets | Biomedical classification with rare events |
| GridSearchCV/RandomizedSearchCV | Automated hyperparameter search with cross-validation | Systematic regularization parameter optimization |
| Pipeline Tools | Ensures proper preprocessing application during cross-validation | Preventing data leakage in complex workflows |
| Early Stopping Callbacks | Halts training when validation performance plateaus | Deep learning; iterative algorithms |
| Biomedical Benchmarks (DrugBank, Davis, KIBA) | Standardized datasets for method comparison | Drug-target interaction prediction |
Integrated Validation Protocol for Drug Discovery Applications
For researchers in drug development, the following integrated protocol ensures rigorous model validation:
Pre-Experimental Planning:
- Determine sample size requirements based on expected effect sizes
- Define primary and secondary performance metrics aligned with application goals
- Establish validation hierarchy: training, validation (CV), and independent test sets
Data Preparation:
- Perform initial data quality control and preprocessing
- Implement patient-wise or batch-wise splitting to prevent data leakage [125]
- Allocate independent test set (20-30%) before any analysis
Model Development with Cross-Validation:
- Select appropriate cross-validation strategy based on dataset characteristics
- Implement nested CV if both algorithm selection and hyperparameter tuning required
- Regularization parameter optimization through inner CV loop
- Monitor training and validation curves to detect overfitting
Final Model Assessment:
- Train final model on complete training set with optimal parameters
- Evaluate on strictly held-out independent test set
- Report performance metrics with confidence intervals
- Conduct error analysis to identify failure modes
Uncertainty Quantification (where applicable):
- Implement evidential deep learning or Bayesian methods for confidence estimation [122]
- Use uncertainty measures to prioritize experimental validation candidates
The integration of cross-validation and independent test sets provides a robust methodological foundation for developing predictive models in drug discovery research. When combined with appropriate regularization techniques, these validation strategies mitigate the risk of overfitting and provide realistic performance estimates that translate to real-world applications. As computational models continue to play increasingly prominent roles in guiding drug development decisions, the rigorous application of these validation principles becomes essential for building trustworthy, translatable predictive systems. The protocols outlined herein offer researchers a structured approach to model validation that balances computational efficiency with statistical rigor, ultimately accelerating the development of more effective and targeted therapeutics.
The relentless pursuit of higher accuracy in machine learning, particularly within critical fields like computational drug discovery, often pushes models toward increasing complexity. This complexity brings with it the persistent danger of overfitting, where a model learns the noise and specific patterns of its training data rather than the underlying signal, crippling its performance on new, unseen data. Regularization techniques stand as the essential countermeasure to this problem, constraining models to ensure they generalize effectively. This Application Note synthesizes findings from recent benchmark studies and cutting-edge research to provide a structured comparison of regularization techniques and detailed experimental protocols. The focus is on empowering researchers and scientists to make informed, data-driven decisions when implementing regularization strategies, especially in data-sensitive domains like drug development, where model reliability is paramount.
Quantitative Benchmarking of Regularization Techniques
Recent comprehensive benchmarks provide critical insights into the performance of various regularization methods across different model architectures. The tables below summarize key quantitative findings and characterize the techniques.
Table 1: Performance Comparison of Regularization Techniques in Image Classification
| Model Architecture | Regularization Technique | Dataset | Key Performance Metric | Result | Generalization Gap Reduction |
|---|---|---|---|---|---|
| Baseline CNN [4] | Dropout & Data Augmentation | Imagenette [4] | Validation Accuracy | 68.74% [4] | Significant Reduction [4] |
| ResNet-18 [4] | Dropout & Data Augmentation | Imagenette [4] | Validation Accuracy | 82.37% [4] | Significant Reduction [4] |
| Custom CNN [129] | L1 Regularization (λ=0.01) | MNIST [129] | Classification Accuracy | Enhanced Accuracy [129] | Effective Prevention of Overfitting [129] |
| Custom CNN [129] | Dual L1 (Conv: λ=0.001, Dense: λ=0.01) | Mango Tree Leaves [129] | Classification Accuracy & Interpretability | Improved Performance [129] | Improved Generalization [129] |
Table 2: Characteristics and Applications of Common Regularization Techniques
| Technique | Core Mechanism | Primary Effect | Best-Suited Architectures/Scenarios | Advantages | Disadvantages |
|---|---|---|---|---|---|
| L1 (Lasso) [3] [129] | Adds penalty equal to absolute value of coefficients to loss function. | Encourages sparsity; performs feature selection by driving some weights to zero. [3] [129] | Models with many features; scenarios requiring feature interpretation and simplicity. [129] | Creates simpler, more interpretable models. [129] | May oversimplify if key features are incorrectly zeroed out. |
| L2 (Ridge) [3] [78] | Adds penalty equal to square of the magnitude of coefficients to loss function. | Shrinks all weights proportionally without forcing them to zero. [3] | General-purpose use; most deep learning architectures (CNNs, ResNet). [4] [78] | Promotes stability and robust performance. [78] | Does not perform feature selection; all features are retained. |
| Dropout [4] [130] | Randomly "drops" a subset of neurons during each training step. | Prevents co-adaptation of features; creates an implicit ensemble of sub-networks. [4] | Fully connected layers in CNNs and other large networks prone to complex co-adaptations. [4] | Highly effective and simple to implement. [130] | Increases training time; may require more epochs to converge. [130] |
| Data Augmentation [4] [78] | Artificially expands training set using label-preserving transformations. | Teaches the model to be invariant to irrelevant variations (e.g., rotation, scaling). [78] | Image and data-scarce domains; virtually all computer vision tasks. [4] [78] | Very effective; leverages existing data more efficiently. [4] | Domain-specific transformations must be carefully designed. |
| Topological Regularization [131] | Introduces constraints based on the known structure of a network (e.g., biological). | Guides model to learn representations consistent with underlying network topology. | Graph Neural Networks (GNNs) on multimodal biological or network data. [131] | Incorporates domain knowledge; improves generalization on structured data. [131] | Complex to implement; requires prior knowledge of the network structure. |
Key Insights from Benchmarking
- Architecture Matters: Benchmarks confirm that architectural innovations like ResNet's residual connections inherently improve generalization and respond better to regularization compared to baseline CNNs, achieving significantly higher validation accuracy (82.37% vs. 68.74%) on the same dataset and with similar regularization [4]. This suggests that investing in a modern architecture can be as crucial as selecting the right regularization technique.
- The L1 Advantage for Interpretability: While L2 is a common default, L1 regularization shines in scenarios where model interpretability is required. By driving less important weights to zero, it effectively performs feature selection, simplifying the model and highlighting the most critical input features, as demonstrated in leaf and sketch classification tasks [129].
- Combination and Specificity are Key: No single technique is a silver bullet. State-of-the-art models often employ combined strategies. For example, one benchmark utilized dropout, data augmentation, and early stopping concurrently [4]. Furthermore, fine-tuning regularization for specific layers (e.g., using different L1 coefficients for convolutional and dense layers) can yield superior results [129].
Detailed Experimental Protocols
This section outlines reproducible methodologies for implementing and evaluating regularization techniques, drawing from recent peer-reviewed studies.
Protocol: Benchmarking Regularization on Image Classification Tasks
This protocol is adapted from large-scale comparative studies [4] [129].
1. Research Reagent Solutions
| Item | Function |
|---|---|
| Imagenette/MNIST Datasets | Standardized benchmark datasets for evaluating model generalization. [4] [129] |
| PyTorch / TensorFlow Framework | Open-source ML frameworks providing implementations of L1/L2, Dropout, and data augmentation. [49] |
| GPU Cluster (e.g., NVIDIA V100) | High-performance computing hardware to manage the computational load of multiple training runs. [4] |
| SCIKIT-LEARN | Library for data splitting, baseline model evaluation, and metric calculation. [49] |
2. Experimental Workflow
The following diagram outlines the core benchmarking workflow.
3. Step-by-Step Instructions
Step 1: Data Preparation and Splitting
Step 2: Define Model Architectures and Regularization Techniques
- Select a range of architectures (e.g., a baseline CNN and a ResNet-18 [4]).
- For each architecture, define a set of regularization strategies to benchmark. For example:
- Baseline: No explicit regularization.
- L2: Add L2 weight decay to all convolutional and dense layers. Test different values (e.g., 0.001, 0.01, 0.1).
- Dropout: Add dropout layers after activation functions. Test different rates (e.g., 0.2, 0.5 [130]).
- Combined: Apply both L2 and Dropout.
Step 3: Implement Training with Cross-Validation and Early Stopping
- Train each model-regularization combination using a k-fold cross-validation (e.g., k=5) on the training set [16].
- Implement early stopping by monitoring the validation loss. Halt training if the validation loss fails to improve for a predetermined number of epochs (e.g., 10 epochs) and revert to the best model [4] [130]. This itself is a form of regularization.
- Use a consistent optimizer (e.g., Adam) and learning rate across experiments to ensure a fair comparison.
Step 4: Evaluation and Analysis
- Evaluate the final model from each experimental run on the held-out test set.
- Record key metrics: test accuracy, test loss, and the generalization gap (difference between training and test accuracy [4]).
- Analyze results to identify the technique that best minimizes the generalization gap while maintaining high test accuracy.
Protocol: Applying Topological Regularization in Drug Repositioning
This protocol is based on the STRGNN model for predicting drug-disease associations using multimodal biological networks [131].
1. Research Reagent Solutions
| Item | Function |
|---|---|
| Biological Databases (DrugBank, STRING) | Sources for constructing multimodal networks of proteins, RNAs, metabolites, and drugs. [131] |
| Graph Neural Network (GNN) Library (e.g., PyTorch Geometric) | Framework for building and training GNN models with custom regularization. |
| Topological Regularization Loss Function | A custom loss component that penalizes representations inconsistent with the known biological network structure. [131] |
2. Experimental Workflow
The following diagram illustrates the process of building and applying a topologically regularized GNN.
3. Step-by-Step Instructions
Step 1: Construct a Multimodal Biological Network
- Integrate data from sources like DrugBank, STRING, and HMDB to build a heterogeneous graph.
- Node types should include drugs, diseases, proteins, mRNAs, miRNAs, and metabolites.
- Edge types should represent interactions and associations (e.g., drug-target, disease-gene, protein-protein interactions) [131].
Step 2: Implement the Graph Neural Network Encoder
- Use a Relational Graph Convolutional Network (R-GCN) [130] or similar GNN capable of handling multiple node and edge types.
- The GNN encoder processes the multimodal network to generate latent vector representations (embeddings) for each node, particularly the drug and disease nodes.
Step 3: Apply Topological Regularization
- Define a topological regularization loss term. This term penalizes the model if the learned embeddings of strongly connected nodes (e.g., a drug and its known protein target) are dissimilar in the latent space.
- This loss function acts as a constraint, guiding the model to learn representations that are consistent with the underlying biological topology, thereby filtering out noise and improving generalization [131].
Step 4: Train the Model for Drug-Disease Prediction
- The primary task is a link prediction between drug and disease nodes.
- The total loss function is a weighted sum:
Total Loss = Prediction Loss (e.g., BCE) + β * Topological Regularization Loss, whereβcontrols the strength of the regularization [131]. - Train the model and evaluate its performance on predicting held-out drug-disease associations, comparing against methods without topological regularization.
The Scientist's Toolkit: Research Reagent Solutions
The following table consolidates key materials and tools referenced in the protocols and studies.
| Category | Item | Specific Example / Parameter | Function in Regularization Context |
|---|---|---|---|
| Software & Libraries | ML Frameworks [49] | PyTorch, TensorFlow, Keras | Provide built-in functions for L1/L2 penalties, Dropout layers, and data augmentation pipelines. |
| Chemoinformatics Suites | RDKit | Generate molecular features for drug discovery models, where L1 can select the most relevant features [49]. | |
| GNN Libraries | PyTorch Geometric, Deep Graph Library | Facilitate the implementation of topological regularization on graph-structured data [131]. | |
| Datasets | Image Classification [4] [129] | MNIST, Imagenette, Quick, Draw! | Standardized benchmarks for evaluating generalization performance of regularization techniques. |
| Drug Discovery [131] [49] | Cdataset, Fdataset, DrugBank | Curated biological networks and association data for training regularized models in bioinformatics. | |
| Regularization Techniques | L1 (Lasso) [3] [129] | Coefficient (λ) = 0.001 - 0.01 | Adds penalty as absolute value of weights; promotes sparsity and feature selection. |
| L2 (Ridge) [3] [78] | Coefficient (λ) = 0.001 - 0.1 | Adds penalty as square of weights; promotes small weights without forcing sparsity. | |
| Dropout [4] [130] | Rate = 0.2 - 0.5 | Randomly disables neurons during training to prevent co-adaptation. | |
| Data Augmentation [4] [78] | Rotation, Flipping, Cropping | Artificially expands training data to improve model invariance and robustness. | |
| Topological Regularization [131] | Custom loss term | Uses known network structure to guide learning and filter redundant data modalities. |
Conclusion
Regularization is not merely a technical step but a fundamental requirement for developing trustworthy machine learning models in drug discovery and biomedical research. By understanding the foundational principles, strategically applying a suite of regularization methods, diligently troubleshooting model performance, and rigorously validating results, researchers can significantly enhance model generalizability. Future directions should focus on adaptive regularization techniques that automatically adjust to data complexity, the integration of regularization within multimodal and multi-omics analysis frameworks, and the development of standardized regularization protocols to improve the reproducibility and reliability of predictive models in clinical and translational science. Embracing these practices will be pivotal in reducing attrition rates and accelerating the delivery of new therapies.
References
- 1. The Definition of Overfitting [https://time.com/collections/the-ai-dictionary-from-allbusiness-com/7273978/definition-of-overfitting/]
- 2. Overfitting in Machine Vision Explained [https://www.unitxlabs.com/overfitting-machine-vision-explained/]
- 3. Overfitting and Regularization in ML [https://www.geeksforgeeks.org/machine-learning/overfitting-and-regularization-in-ml/]
- 4. Comparative Deep Learning Analysis of Regularization ... [https://www.preprints.org/manuscript/202511.0501]
- 5. Comparative Deep Learning Analysis of Regularization ... [https://sciety-labs.elifesciences.org/articles/by?article_doi=10.20944/preprints202511.0501.v1]
- 6. 5 Comparative Analysis of Regularization Methods for ... [https://lamethods.org/book2/chapters/ch05-regularization/ch05-regularization.html]
- 7. Understanding Regularization: Prevent Overfitting & ... [https://www.lyzr.ai/glossaries/regularization/]
- 8. A scoping review of artificial intelligence applications in ... [https://www.nature.com/articles/s41746-025-01886-7]
- 9. Artificial intelligence in pharmacovigilance: advancing drug ... [https://pmc.ncbi.nlm.nih.gov/articles/PMC12317250/]
- 10. Fail Fast, Save Smart: A Silicon Valley Approach to Drug ... [https://www.pharmexec.com/view/fail-fast-save-smart-silicon-valley-approach-drug-development-cut-costs-improve-access]
- 11. Clinical trial regulations in 2025: navigating the constraints [https://clinicaltrialrisk.org/clinical-trial-design/clinical-trial-regulations-navigating-the-constraints/]
- 12. AI-based prediction of drug-gene interactions modulating tight ... [https://pmc.ncbi.nlm.nih.gov/articles/PMC12590139/]
- 13. Clinical trials informed framework for real world ... [https://www.nature.com/articles/s41746-025-01506-4]
- 14. Understanding the Bias-Variance Tradeoff and ... [https://medium.com/@lomashbhuva/understanding-the-bias-variance-tradeoff-and-regularization-in-machine-learning-cdc5dd5e260e]
- 15. What is Bias-Variance Tradeoff? [https://www.ibm.com/think/topics/bias-variance-tradeoff]
- 16. Underfitting vs. Overfitting in Machine Learning [https://www.ayadata.ai/a-guide-to-overfitting-and-underfitting-in-machine-learning/]
- 17. Bias-Variance Tradeoff in Machine Learning - AwesomeNeuron [https://awesomeneuron.substack.com/p/bias-variance-tradeoff-in-machine]
- 18. Bias-Variance Tradeoff for dummies: A No-Nonsense Guide [https://medium.com/@vennetishreeya/a-guide-to-the-bias-variance-tradeoff-in-machine-learning-d9ba4466b018]
- 19. Bias-Variance Tradeoff Decomposition based Machine ... [https://sciety-labs.elifesciences.org/articles/by?article_doi=10.21203/rs.3.rs-6442602/v1]
- 20. - ( Overfitting Engineering II) - Vocab, Definition... | Fiveable Biomedical [https://fiveable.me/key-terms/biomedical-engineering-ii/overfitting]
- 21. A 2025 perspective on the role of machine learning for ... [https://pubmed.ncbi.nlm.nih.gov/40772544/]
- 22. Predictive overfitting in immunological applications: Pitfalls and... [https://pmc.ncbi.nlm.nih.gov/articles/PMC10498807/]
- 23. Artificial intelligence in clinical decision support and the ... [https://pmc.ncbi.nlm.nih.gov/articles/PMC12162700/]
- 24. WEFormer: Classification for physiological time series with ... [https://www.sciencedirect.com/science/article/abs/pii/S1746809425003532]
- 25. in Machine Learning: Overfitting , Detection, and Prevention Causes [https://www.lightly.ai/blog/overfitting]
- 26. Optimizing high dimensional data classification with a ... [https://www.nature.com/articles/s41598-025-08699-4]
- 27. Flexynesis: A deep learning toolkit for bulk multi-omics data ... [https://www.nature.com/articles/s41467-025-63688-5]
- 28. Feature Selection in Healthcare Datasets: Towards a ... [https://www.sciencedirect.com/science/article/pii/S0010482525011631]
- 29. What Is Regularization? | IBM [https://www.ibm.com/think/topics/regularization]
- 30. Overfitting in Machine Learning Explained [https://encord.com/blog/overfitting-in-machine-learning/]
- 31. and Training in Deep Validation - GeeksforGeeks Loss Learning [https://www.geeksforgeeks.org/deep-learning/training-and-validation-loss-in-deep-learning/]
- 32. How to Fix Overfitting and Underfitting | by Tahir | Oct, 2025 [https://medium.com/@tahirbalarabe2/how-to-fix-overfitting-and-underfitting-4cf8f383ea96]
- 33. Overfitting, Model Tuning, and Evaluation of Prediction ... - NCBI [https://www.ncbi.nlm.nih.gov/books/NBK583970/]
- 34. Overfitting in Machine Learning Explained [https://aws.amazon.com/what-is/overfitting/]
- 35. Regularization in Machine Learning [https://www.geeksforgeeks.org/machine-learning/regularization-in-machine-learning/]
- 36. The Relationship Between High Dimensionality and ... [https://www.geeksforgeeks.org/machine-learning/the-relationship-between-high-dimensionality-and-overfitting/]
- 37. Regularization in Machine Learning: A Guide to Prevent ... [https://medium.com/@aarongebremariam.94/regularization-in-machine-learning-a-guide-to-prevent-overfitting-cfda6736712e]
- 38. SMAGS-LASSO: A Novel Feature Selection Method for ... [https://pmc.ncbi.nlm.nih.gov/articles/PMC12570486/]
- 39. Bayesian Two-step Lasso Strategy for Biomarker Selection ... [https://pmc.ncbi.nlm.nih.gov/articles/PMC3873734/]
- 40. Tissue-guided LASSO for prediction of clinical drug response ... [https://journals.plos.org/ploscompbiol/article?id=10.1371/journal.pcbi.1007607]
- 41. Usable Data Visualization for Digital Biomarkers [https://pmc.ncbi.nlm.nih.gov/articles/PMC9719035/]
- 42. Ridge Regression: A Robust Path to Reliable Predictions [https://towardsdatascience.com/ridge-regression-a-robust-path-to-reliable-predictions-851290bed579/]
- 43. What Is Ridge Regression? | IBM [https://www.ibm.com/think/topics/ridge-regression]
- 44. Ridge regression [https://en.wikipedia.org/wiki/Ridge_regression]
- 45. Ridge — scikit-learn 1.7.2 documentation [https://scikit-learn.org/stable/modules/generated/sklearn.linear_model.Ridge.html]
- 46. Regularization in Linear Regression: A Deep Dive into ... [https://medium.com/@maxwienandts/regularization-in-linear-regression-a-deep-dive-into-ridge-and-lasso-3d2853e5e2b0]
- 47. Machine learning analysis and simulation of ... [https://www.nature.com/articles/s41598-025-22276-9]
- 48. Transforming modern drug discovery with machine learning [https://www.sciencedirect.com/science/article/pii/S0065774325000016]
- 49. Applications of machine learning in drug discovery and ... [https://pmc.ncbi.nlm.nih.gov/articles/PMC6552674/]
- 50. An elastic-net logistic regression approach to generate ... [https://pmc.ncbi.nlm.nih.gov/articles/PMC6704630/]
- 51. Priority-Elastic net for binary disease outcome prediction ... [https://pmc.ncbi.nlm.nih.gov/articles/PMC11523883/]
- 52. How Elastic Net Regression Bridges the Gap Between ... [https://ujangriswanto08.medium.com/how-elastic-net-regression-bridges-the-gap-between-overfitting-and-underfitting-d8849fdf29e0]
- 53. Mastering L1 and L2 Regularization: The Definitive Guide ... [https://www.lunartech.ai/blog/mastering-l1-and-l2-regularization-the-definitive-guide-to-preventing-overfitting-in-neural-networks]
- 54. What are L1, L2 and Elastic Net Regularization in neural ... [https://machinecurve.com/index.php/2020/01/21/what-are-l1-l2-and-elastic-net-regularization-in-neural-networks]
- 55. Elastic net regularization [https://en.wikipedia.org/wiki/Elastic_net_regularization]
- 56. Elastic Net Regression —Combined Features of L1 and L2 ... [https://medium.com/@abhishekjainindore24/elastic-net-regression-combined-features-of-l1-and-l2-regularization-6181a660c3a5]
- 57. Courage to Learn ML: Demystifying L1 & L2 Regularization ... [https://towardsdatascience.com/courage-to-learn-ml-demystifying-l1-l2-regularization-part-3-ee27cd4b557a/]
- 58. Consistency-Regularized Graph Neural Networks for ... [https://www.sciencedirect.com/science/article/abs/pii/S0893608025010378]
- 59. A Review on Dropout Regularization Approaches for Deep ... [https://www.mdpi.com/2079-9292/12/14/3106]
- 60. On the Topology Awareness and Generalization ... [https://arxiv.org/abs/2403.04482]
- 61. A Survey of Graph Neural Networks for Drug Discovery [https://arxiv.org/html/2509.07887v1]
- 62. Graph Neural Networks and Their Current Applications in ... [https://pmc.ncbi.nlm.nih.gov/articles/PMC8360394/]
- 63. Mitigating over-smoothing in Graph Neural Networks for ... [https://www.sciencedirect.com/science/article/abs/pii/S0950705125006616]
- 64. Accelerating GNN Training through Locality-aware Dropout ... [https://arxiv.org/html/2506.21414v1]
- 65. A Topological Perspective on Demystifying GNN-Based ... [https://openreview.net/forum?id=apA6SSXx2e]
- 66. Mitigating Overfitting in Graph Neural Networks via Feature ... [https://arxiv.org/html/2211.15081v8]
- 67. Regularization Techniques: Preventing Overfitting in Deep Learning | by Sruthy Nath | Medium [https://medium.com/@sruthy.sn91/regularization-techniques-preventing-overfitting-in-deep-learning-2cddb7822217]
- 68. Deep learning for low-data drug discovery: Hurdles and ... [https://www.sciencedirect.com/science/article/pii/S0959440X24000459]
- 69. Regularization in Neural Networks | Pinecone [https://www.pinecone.io/learn/regularization-in-neural-networks/]
- 70. Understanding Regularization Techniques in Machine Learning: L1, L2, Dropout, Data Augmentation, and Early Stopping. | by Oche Ankeli | Medium [https://medium.com/@o.ankeli/understanding-regularization-techniques-in-machine-learning-l1-l2-dropout-data-augmentation-7a8f61b95e8f]
- 71. Integrating data augmentation and BERT-based deep ... [https://www.nature.com/articles/s41598-025-14699-1]
- 72. Overfitting: L2 regularization | Machine Learning [https://developers.google.com/machine-learning/crash-course/overfitting/regularization]
- 73. Deep Learning: Hyperparameter tuning, Regularization ... [https://medium.com/@krushnakr9/deep-learning-hyperparameter-tuning-regularization-and-optimization-e1a8a9ba532b]
- 74. Shrink to Win: Regularization's Role in Model Success [https://www.gaussianwaves.com/2025/03/regularization-techniques-role-in-model-success/]
- 75. What Is Hyperparameter Tuning? [https://www.ibm.com/think/topics/hyperparameter-tuning]
- 76. A method combining LDA and neural networks for ... [https://pmc.ncbi.nlm.nih.gov/articles/PMC11384538/]
- 77. DSPLMF: A Method for Cancer Drug Sensitivity Prediction ... [https://www.frontiersin.org/journals/genetics/articles/10.3389/fgene.2020.00075/full]
- 78. Exploring Regularization for Better Machine Vision Models [https://www.unitxlabs.com/regularization-machine-vision-models/]
- 79. Hyperparameter Tuning [https://www.geeksforgeeks.org/machine-learning/hyperparameter-tuning/]
- 80. What Is Hyperparameter Tuning? [https://builtin.com/articles/hyperparameter-tuning]
- 81. Overfitting In Academic Research [https://www.meegle.com/en_us/topics/overfitting/overfitting-in-academic-research]
- 82. Overfitting, Underfitting and General Model Overconfidence ... [https://www.ncbi.nlm.nih.gov/books/NBK610560/]
- 83. How to Avoid Overfitting in Machine Learning? [https://www.geeksforgeeks.org/machine-learning/how-to-avoid-overfitting-in-machine-learning/]
- 84. Prevent overfitting and imbalanced data with Automated ML [https://learn.microsoft.com/en-us/azure/machine-learning/concept-manage-ml-pitfalls?view=azureml-api-2]
- 85. SPIRIT 2025 statement: Updated guideline for protocols of ... [https://pmc.ncbi.nlm.nih.gov/articles/PMC12037212/]
- 86. AI Model Optimization Techniques for Enhanced ... [https://www.netguru.com/blog/ai-model-optimization]
- 87. Mastering Regularization : Techniques to Prevent in... Overfitting [https://medium.com/@t.tuiaiho/mastering-regularization-techniques-to-prevent-overfitting-in-machine-learning-8baf005242e4]
- 88. in Machine Learning | Ultralytics Regularization [https://www.ultralytics.com/glossary/regularization]
- 89. Optimization Strategies Applied to Deep Learning Models ... [https://www.mdpi.com/2076-3417/15/9/4632]
- 90. AI and Deep Learning Accelerators Beyond GPUs in 2025 [https://www.bestgpusforai.com/blog/ai-accelerators]
- 91. Mastering Deep Learning in 2025: Your Ultimate Roadmap to ... [https://www.pass4sure.com/blog/mastering-deep-learning-in-2025-your-ultimate-roadmap-to-success/]
- 92. Exploring L1 and L2 Regularization Techniques for Model Simplicity [https://www.numberanalytics.com/blog/exploring-l1-l2-regularization-techniques]
- 93. Fighting Overfitting With L1 or L2 Regularization : Which One Is Better? [https://neptune.ai/blog/fighting-overfitting-with-l1-or-l2-regularization]
- 94. Cross-Validated Regularized Regression [https://www.emergentmind.com/topics/cross-validated-regularized-linear-regression]
- 95. Regularization approaches in clinical biostatistics: A review of ... [https://pmc.ncbi.nlm.nih.gov/articles/PMC9896544/]
- 96. Integration of nested cross-validation, automated ... [https://www.sciencedirect.com/science/article/abs/pii/S0169260725004808]
- 97. Machine Learning for Toxicity Prediction Using Chemical ... [https://pmc.ncbi.nlm.nih.gov/articles/PMC12093382/]
- 98. How Regularization Keep Your Model Honest [https://medium.com/@pacosun/when-less-is-more-how-regularization-hyperparameters-keep-your-model-honest-9176bc8a1583]
- 99. Multimodal deep learning for chemical toxicity prediction ... [https://www.nature.com/articles/s41598-025-95720-5]
- 100. Computational toxicology in drug discovery: applications of ... [https://pmc.ncbi.nlm.nih.gov/articles/PMC12499773/]
- 101. A robust and statistical analyzed predictive model for drug ... [https://www.nature.com/articles/s41598-025-02333-z]
- 102. Prevent Overfitting Using Regularization Techniques [https://www.analyticsvidhya.com/blog/2021/07/prevent-overfitting-using-regularization-techniques/]
- 103. A Comprehensive Guide to Regularization in Machine ... [https://medium.com/@juanc.olamendy/a-comprehensive-guide-to-regularization-in-machine-learning-9d1243002c50]
- 104. Regularization-based methods for ordinal quantification [https://link.springer.com/article/10.1007/s10618-024-01067-2]
- 105. Top 50 AI Model Benchmarks & Evaluation Metrics (2025 Guide) [https://o-mega.ai/articles/top-50-ai-model-evals-full-list-of-benchmarks-october-2025]
- 106. Revisiting Generalization Across Difficulty Levels: It's Not ... [https://arxiv.org/html/2511.21692v1]
- 107. Choice of Regularization Methods in Experiment Processing [https://www.mdpi.com/2227-7390/10/22/4221]
- 108. Comparative analysis of regression algorithms for drug ... [https://pmc.ncbi.nlm.nih.gov/articles/PMC11726955/]
- 109. Comparative evaluation of feature reduction methods for ... [https://www.nature.com/articles/s41598-024-81866-1]
- 110. Regularization Techniques: Ridge, Lasso and Elastic Net [https://medium.com/@tavishi.1402/regularization-techniques-lasso-and-ridge-90d3cc73ca4c]
- 111. Lasso vs Ridge vs Elastic Net - ML [https://www.geeksforgeeks.org/machine-learning/lasso-vs-ridge-vs-elastic-net-ml/]
- 112. Elastic/ridge/lasso analysis, what then? - Cross Validated [https://stats.stackexchange.com/questions/137798/elastic-ridge-lasso-analysis-what-then]
- 113. PharmaFormer predicts clinical drug responses through ... [https://www.nature.com/articles/s41698-025-01082-6]
- 114. Integrating edge features and complementary attention ... [https://www.sciencedirect.com/science/article/abs/pii/S0950705125005544]
- 115. Drug response prediction: A critical systematic review of ... [https://www.sciencedirect.com/science/article/abs/pii/S0167865525003460]
- 116. KGRDR: a deep learning model based on knowledge ... [https://www.frontiersin.org/journals/pharmacology/articles/10.3389/fphar.2025.1525029/full]
- 117. Deep semantic and structural feature-aware drug ... [https://www.sciencedirect.com/science/article/abs/pii/S0952197625031665]
- 118. A fused deep learning approach to transform drug ... [https://www.nature.com/articles/s42004-025-01712-x]
- 119. Deep learning for drug repurposing: methods, databases ... [https://blog.csdn.net/qq_45069496/article/details/127266943]
- 120. Overfitting in Machine Learning: What It Is and How to ... [https://elitedatascience.com/overfitting-in-machine-learning]
- 121. Discovery and validation of biomarkers to aid the development ... [https://pmc.ncbi.nlm.nih.gov/articles/PMC7326705/]
- 122. Evidential deep learning-based drug-target interaction ... [https://www.nature.com/articles/s41467-025-62235-6]
- 123. Choosing the Regularization Parameter in Cross-Validation [https://medium.com/data-analytics-magazine/choosing-the-regularization-parameter-in-cross-validation-08103d91ea49]
- 124. 16 Cross Validation and Regularization [https://ds100.org/course-notes/cv_regularization/cv_reg.html]
- 125. A Guide to Cross-Validation for Artificial Intelligence in ... [https://pmc.ncbi.nlm.nih.gov/articles/PMC10388213/]
- 126. Cross-validation (statistics) [https://en.wikipedia.org/wiki/Cross-validation_(statistics)]
- 127. Cross-Validation in Machine Learning: How to Do It Right [https://neptune.ai/blog/cross-validation-in-machine-learning-how-to-do-it-right]
- 128. 3.1. Cross-validation: evaluating estimator performance [https://scikit-learn.org/stable/modules/cross_validation.html]
- 129. Unlocking the power of L1 regularization: A novel approach to ... [https://journals.plos.org/plosone/article?id=10.1371/journal.pone.0327985]
- 130. 8 Simple Techniques to Prevent Overfitting [https://medium.com/data-science/8-simple-techniques-to-prevent-overfitting-4d443da2ef7d]
- 131. Deep learning of multimodal networks with topological ... [https://jcheminf.biomedcentral.com/articles/10.1186/s13321-024-00897-y]