Betweenness Centrality for Autism Gene Prioritization: A Systems Biology Framework for Complex Disorder Research
Autism Spectrum Disorder (ASD) presents a complex genetic architecture that traditional genome-wide studies often struggle to decode.
Betweenness Centrality for Autism Gene Prioritization: A Systems Biology Framework for Complex Disorder Research
Abstract
Autism Spectrum Disorder (ASD) presents a complex genetic architecture that traditional genome-wide studies often struggle to decode. This article details a systems biology framework that leverages betweenness centrality in Protein-Protein Interaction (PPI) networks to prioritize ASD-associated genes from large and noisy genomic datasets. We explore the foundational principles of network analysis in neurodevelopmental disorders, provide a methodological guide for constructing and analyzing ASD-specific PPI networks, address common challenges in specificity and validation, and compare the performance of betweenness centrality against other computational methods. Designed for researchers and drug development professionals, this resource synthesizes current evidence and practical strategies to enhance the discovery of high-confidence ASD risk genes, ultimately contributing to a deeper understanding of the disorder's molecular underpinnings.
Understanding Network Theory and the Genetic Complexity of Autism
The Challenge of Genetic Heterogeneity in Autism Spectrum Disorder
Autism Spectrum Disorder (ASD) represents a complex neurodevelopmental condition characterized by significant genetic and phenotypic heterogeneity. This heterogeneity poses substantial challenges for identifying coherent genetic signatures and developing targeted interventions. Genetic heterogeneity in ASD manifests through hundreds of associated genes, with each accounting for typically less than 1% of cases [1]. Despite this complexity, emerging approaches leveraging network biology and computational methods provide promising pathways for deciphering ASD's genetic architecture.
The betweenness centrality metric within protein-protein interaction (PPI) networks has emerged as a powerful tool for prioritizing candidate genes amidst this heterogeneity. This approach operates on the principle that genes involved in ASD often occupy central positions in biological networks, serving as critical connectors in molecular pathways relevant to neurodevelopment [2]. By integrating multi-omics data with network propagation techniques, researchers can now systematically identify key nodal genes that might otherwise be obscured by the condition's genetic complexity.
Quantitative Landscape of ASD Genetic Heterogeneity
Documented Genetic Associations
The scale of genetic findings in ASD research reflects the substantial heterogeneity inherent to the condition. Large-scale genomic studies have identified hundreds of genes associated with ASD, yet the full genetic landscape remains incomplete [2]. The Simons Foundation Autism Research Initiative (SFARI) database has curated multiple categories of evidence, with high-confidence (Score 1) and strong candidate (Score 2) genes forming the foundation for many network-based analyses.
Table 1: Documented Genetic Associations in ASD Research
| Evidence Source | Gene Count | Key Characteristics | Primary Applications |
|---|---|---|---|
| SFARI Database (Scores 1-2) | 768 genes | Non-syndromic ASD associations; validated through multiple evidence streams | Seed genes for network propagation; training data for machine learning models |
| GWAS Catalog (ASD-associated) | 305 genes | Common variants identified through genome-wide association | Polygenic risk score development; common variant pathway analysis |
| Developmental Brain Disorder Database | 672 genes | Curated associations with neurodevelopmental dimensions | Biological pathway validation; phenotypic correlation studies |
| De Novo Mutations | 117 risk genes | Likely gene-disrupting mutations with strong functional impact | Constraint-based prioritization; developmental expression analysis |
Phenotypic Heterogeneity Classes
Recent work has demonstrated that phenotypic decomposition can identify clinically meaningful subgroups within ASD that correspond to distinct genetic programs. Using generative mixture modeling on broad phenotypic data from 5,392 individuals, four robust classes have been identified with distinct clinical and genetic profiles [3]:
Table 2: Phenotypic Classes in ASD and Their Characteristics
| Phenotypic Class | Sample Size | Core Features | Genetic Correlates | Clinical Outcomes |
|---|---|---|---|---|
| Social/Behavioral | 1,976 | High scores in social communication deficits, disruptive behavior, attention deficit | Distinct patterns of common genetic variation measured by polygenic scores | Higher levels of ADHD, anxiety, depression; multiple interventions |
| Mixed ASD with DD | 1,002 | Nuanced presentation with strong developmental delays enrichment | Rare inherited variation; pathway-specific disruptions | Earlier age at diagnosis; language delay; intellectual disability |
| Moderate Challenges | 1,860 | Consistently lower scores across all measured difficulty categories | Milder genetic burden profiles | Better functional outcomes; later diagnosis |
| Broadly Affected | 554 | High scores across all seven phenotype categories | Multiple hit patterns; severe mutational burden | Extensive co-occurring conditions; highest intervention needs |
Betweenness Centrality Gene Prioritization: Core Methodology
Protocol: Network Construction and Gene Prioritization
Purpose: To identify high-priority ASD candidate genes through topological analysis of protein-protein interaction networks using betweenness centrality metrics.
Principle: Betweenness centrality quantifies the fraction of shortest paths passing through a node, identifying genes that serve as critical connectors in biological networks. In ASD research, these central genes often represent key regulators of neurodevelopmental processes [2].
Input Data Preparation
- Seed Gene Collection: Curate high-confidence ASD-associated genes from SFARI database (Score 1 and 2 categories, 768 genes) [2]
- PPI Network Source: Download human protein-protein interactions from IMEx database through International Molecular Exchange Consortium
- Validation Sets: Prepare independent gene sets for validation (SFARI Score 3 genes, genes from CNV studies)
Network Construction Steps
- Retrieve first-order interactors of SFARI seed genes from IMEx database
- Construct comprehensive PPI network containing 12,598 nodes and 286,266 edges [2]
- Validate network specificity by comparing SFARI gene enrichment against 1,000 randomly generated gene sets of equal size (p < 2.2×10⁻¹⁶; one-sample t-test)
- Filter for brain-expressed genes using Human Protein Atlas data (94.3% of network genes expressed in at least one brain region)
Betweenness Centrality Calculation
- Network Representation: Format network as undirected graph G = (V,E) where V represents proteins and E represents physical interactions
- Path Analysis: For each pair of nodes (s,t), compute all shortest paths
Centrality Calculation: For each node v, calculate betweenness centrality using the formula:
CB(v) = Σs≠v≠t∈V (σst(v)/σst)
where σst is the total number of shortest paths from node s to node t, and σst(v) is the number of those paths passing through v
- Normalization: Normalize values to relative betweenness centrality for comparison across networks
Gene Prioritization
- Rank genes by decreasing betweenness centrality score
- Apply threshold for candidate selection (top 30 genes or based on score distribution inflection points)
- Validate prioritization through expression analysis in brain developmental datasets
Protocol: Multi-Omics Network Propagation
Purpose: To integrate diverse genomic data sources for improved ASD gene prediction using network propagation techniques.
Principle: This approach leverages multiple ASD-associated gene lists from different omics layers as seeds for network propagation in a protein-protein interaction network, then integrates these scores using machine learning classification [4].
Feature Generation
Collect ASD Gene Lists from multiple sources:
- GWAS-derived genes
- Differential expression candidates
- Copy number variation regions
- Differential methylation genes
- Alternative splicing candidates
Network Propagation for each gene list:
- Initialize seed proteins with value 1/s (where s = list size)
- Use human PPI network (20,933 proteins, 251,078 interactions)
- Run propagation with damping parameter α = 0.8
- Normalize results using eigenvector centrality to correct for node degree bias
Generate Feature Matrix with propagation scores from all ten gene lists for each gene
Random Forest Classification
Training Set Construction:
- Positive class: SFARI Category 1 genes (206 high-confidence genes)
- Negative class: Randomly selected genes not in SFARI database (206 genes)
Model Training:
- Use sklearn Python package with default parameters
- 100 maximum trees
- No maximum tree depth
- Minimum samples to split: 2
Performance Validation:
- 5-fold cross-validation (AUROC: 0.87, AUPRC: 0.89)
- Application to SFARI Score 2 and 3 genes (p < 3.62e-34 vs. random genes)
Key Findings and Prioritized Genes
Top Betweenness Centrality Candidates
Application of the betweenness centrality methodology to the SFARI-based PPI network has identified several high-priority candidate genes with central topological positions [2]:
Table 3: Top Betweenness Centrality Candidates in ASD PPI Network
| Gene Symbol | SFARI Score | Betweenness Centrality | Relative Betweenness (%) | Brain Expression (TPM) | Known ASD Association |
|---|---|---|---|---|---|
| ESR1 | - | 0.0441 | 100.00 | 1.334 (Low) | Limited evidence |
| LRRK2 | - | 0.0349 | 79.14 | 4.878 (Low) | Limited evidence |
| APP | - | 0.0240 | 54.42 | 561.1 (High) | Alzheimer's association |
| JUN | - | 0.0200 | 45.35 | 97.62 (High) | Signaling pathway role |
| CUL3 | 1 | 0.0150 | 34.01 | 22.88 (Medium) | High confidence ASD gene |
| YWHAG | 3 | 0.0097 | 22.00 | 554.5 (High) | Suggestive evidence |
| MAPT | 3 | 0.0096 | 21.77 | 223.0 (High) | Suggestive evidence |
| MEOX2 | - | 0.0087 | 19.73 | 0.6813 (Low) | Novel candidate |
Functional Enrichment Analysis
Genes prioritized through betweenness centrality and network propagation methods show significant functional enrichment in key biological processes. Analysis of 84 top-ranked genes from network propagation (threshold: 0.947 prediction score) revealed several significantly enriched pathways [4]:
- Chromatin organization and histone modification (p < 0.001)
- Neuron cell-cell adhesion (p < 0.001)
- Regulation of protein ubiquitination (p < 0.001)
- Autistic behavior (Human Phenotype Ontology, p < 0.001)
These enriched pathways highlight the biological relevance of topologically central genes in ASD pathogenesis and suggest potential mechanisms converging from diverse genetic perturbations.
The Scientist's Toolkit: Research Reagent Solutions
Table 4: Essential Research Reagents for ASD Gene Prioritization Studies
| Reagent/Category | Specific Examples | Function in Protocol | Implementation Notes |
|---|---|---|---|
| Gene Databases | SFARI Gene, GWAS Catalog, DBD | Source of seed genes for network analysis | Use standardized gene nomenclature; current versions |
| Interaction Networks | IMEx Consortium, STRING | PPI network construction | IMEx provides curated physical interactions |
| Expression Atlases | BrainSpan, Human Protein Atlas | Brain expression validation | Developmental time course critical for ASD |
| Constraint Metrics | pLI, LOEUF from gnomAD | Gene-level intolerance to variation | pLI > 0.9 indicates LoF intolerance |
| Network Analysis | igraph, Cytoscape | Betweenness centrality calculation | Custom scripts for large-scale networks |
| ML Frameworks | scikit-learn, TensorFlow | Random forest classification | Default parameters often sufficient |
| Enrichment Tools | g:Profiler, DAVID | Functional annotation | Multiple testing correction essential |
Integration with Phenotypic Subtyping
Protocol: Linking Genetic Programs to Phenotypic Classes
Purpose: To associate genetically-defined ASD subgroups with clinically meaningful phenotypic presentations for stratified therapeutic development.
Principle: Recent research demonstrates that robust phenotypic classes in ASD correspond to distinct genetic programs involving common, de novo, and inherited variation [3]. Linking these classes to specific genetic pathways enables targeted intervention strategies.
Phenotypic Class Determination
Data Collection: Gather comprehensive phenotypic data from 239 item-level and composite features including:
- Social Communication Questionnaire-Lifetime (SCQ)
- Repetitive Behavior Scale-Revised (RBS-R)
- Child Behavior Checklist (CBCL)
- Developmental history and milestones
Mixture Modeling: Apply General Finite Mixture Model (GFMM) to accommodate heterogeneous data types (continuous, binary, categorical)
Class Validation: Verify phenotypic separation through:
- Between-class vs. within-class variability assessment
- External validation using medical history questionnaires
- Replication in independent cohorts (e.g., Simons Simplex Collection)
Genetic Program Mapping
- Polygenic Score Analysis: Calculate PGS for each phenotypic class using common variant data
- Rare Variant Burden: Assess de novo and inherited mutation burden in class-specific gene sets
- Pathway Enrichment: Identify biological pathways preferentially disrupted in each class
- Developmental Timing: Correlate expression patterns of class-associated genes with developmental windows
Discussion and Future Directions
The application of betweenness centrality and network-based methods represents a paradigm shift in addressing genetic heterogeneity in ASD. By prioritizing genes based on their topological importance rather than merely statistical association, these approaches identify key regulators and convergent pathways underlying seemingly disparate genetic causes.
The integration of multi-omics data through network propagation has demonstrated superior performance (AUROC: 0.91) compared to single-data source methods [4]. Furthermore, the successful prediction of schizophrenia-associated genes using the same framework highlights shared genetic architecture between neurodevelopmental disorders and validates the biological relevance of the prioritized genes.
Future applications of these methodologies should focus on:
- Temporal dimension incorporation using spatiotemporal gene expression data from developing human brain
- Single-cell resolution networks to capture cell-type specific interactions
- Dynamic network modeling that accounts for changing interactions across development
- Integration with electronic health records for enhanced phenotypic resolution
These advances in computational methods, combined with growing genomic datasets and refined phenotypic characterization, provide a robust framework for addressing the challenge of genetic heterogeneity in ASD and delivering on the promise of precision medicine for neurodevelopmental conditions.
Protein-Protein Interaction (PPI) networks are graph-based representations of the physical and functional contacts between proteins within a cell. In these networks, nodes represent individual proteins, and edges represent the physical or functional interactions between them [5] [6]. These interactions are fundamental to virtually all biological processes, including cellular signaling, metabolic pathways, and transcriptional regulation [7]. The pattern of these interactions forms a complex cellular machinery that controls healthy and diseased states in organisms [5].
PPI networks are a cornerstone of systems biology, providing a framework to move beyond studying individual proteins to understanding their functions within a larger interactive context [5]. The structure of these networks is typically scale-free, meaning most proteins have few connections, while a small number of highly connected proteins, known as hubs, play critical roles in maintaining network integrity [5]. Analyzing these networks allows researchers to decipher relationships between network structure and function, discover novel protein functions, identify functional modules, and uncover conserved molecular interaction patterns [5].
PPI Network Construction and Analysis
Methods for Constructing PPI Networks
Constructing a comprehensive PPI network requires the identification and curation of interactions through both experimental and computational methods. These approaches are often used complementarily to increase coverage and reliability.
Table 1: Experimental Methods for PPI Identification
| Method Type | Specific Technique | Key Principle | Applications & Notes |
|---|---|---|---|
| Biophysical Methods | X-ray crystallography, NMR spectroscopy, Fluorescence | Provides detailed 3D structural information about protein complexes. | Reveals biochemical features of interactions (e.g., binding mechanism, allosteric changes) [5]. |
| Direct High-Throughput | Yeast Two-Hybrid (Y2H) | Tests interaction by fusing proteins to transcription factor domains; interaction activates a reporter gene [5]. | Efficient for mapping entire proteome interactions [5]. |
| Indirect High-Throughput | Gene Co-expression, Synthetic Lethality | Infers interaction from correlated gene expression or genetic interaction profiles [5]. | Based on the assumption that interacting proteins are co-expressed [5]. |
Table 2: Computational Methods for PPI Prediction
| Method Category | Basis of Prediction | Key Advantage | Key Disadvantage |
|---|---|---|---|
| Genomic Context | Gene fusion, conserved gene neighborhood, phylogenetic profiles [6]. | Fast computation, requires few IT resources [6]. | Low coverage rate, uses only genomic features [6]. |
| Machine Learning | Supervised (e.g., SVM, Neural Networks) and Unsupervised learning (e.g., K-means) [6]. | Handles multi-dimensional data with high efficiency [6]. | Requires massive datasets and significant IT resources [6]. |
| Text Mining | Natural Language Processing (NLP) of scientific literature [6]. | Inexpensive and rapid, with easily accessible data [6]. | Limited to interactions already cited in articles [6]. |
Key Topological Properties for Network Analysis
The analysis of PPI networks relies on graph theory concepts to quantify the importance of individual proteins and the overall structure of the network. Key topological properties provide insight into the functional organization of the interactome.
Table 3: Key Topological Properties in PPI Network Analysis
| Term | Definition | Biological Interpretation |
|---|---|---|
| Node/Degree | A protein in the network. The number of connections a node has [5]. | A protein with a high degree (hub) is often essential for cellular function [5]. |
| Betweenness Centrality | Measures how often a node lies on the shortest path between other nodes [2]. | Identifies bottleneck proteins that connect functional modules; high value indicates critical communication roles [2]. |
| Closeness Centrality | Measures how quickly a node can reach all other nodes in the network [8]. | Identifies proteins that can rapidly influence the entire network or a specific module. |
| Clustering Coefficient | Measures the tendency of a node's neighbors to connect to each other [5]. | High values indicate dense local neighborhoods, potentially corresponding to protein complexes [5]. |
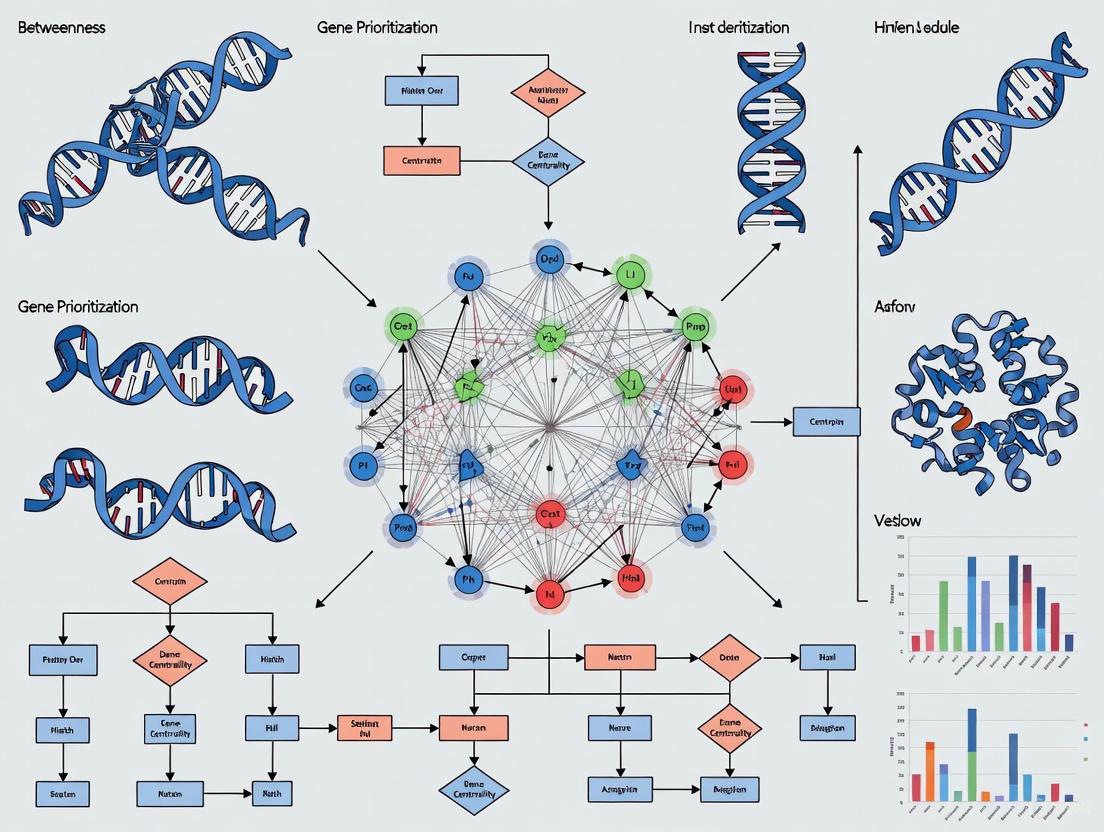
Figure 1: A generalized workflow for gene prioritization using betweenness centrality in a PPI network.
Application Note: Betweenness Centrality for Gene Prioritization in Autism Research
Protocol: A Systems Biology Workflow for ASD Gene Prioritization
This protocol details a systems biology approach to prioritize candidate genes for Autism Spectrum Disorder (ASD) by leveraging betweenness centrality in a PPI network.
Step 1: Compile the Initial Gene Set
- Source the ASD-associated genes from the Simons Foundation Autism Research Initiative (SFARI) Gene database. A typical starting point includes genes from SFARI scores 1 (high confidence) and 2 (strong candidate) [2].
- Action: Perform data cleaning to remove duplicates and isolated nodes with no known interactions to refine the network [8].
Step 2: Construct the PPI Network
- Tool: Use a public PPI database such as STRING or IMEx. Restrict the search to Homo sapiens [2] [8].
- Action: Query the database with the compiled gene list to retrieve all known physical interactions between them. This will form the core network (nodes = proteins, edges = interactions).
Step 3: Calculate Topological Properties
- Tool: Utilize network analysis tools (e.g., Cytoscape with its plugins, or custom Python scripts using libraries like NetworkX).
- Action: Calculate the betweenness centrality for every node in the network. The betweenness centrality for a node ( vi ) is calculated as: ( CB(vi) = \sum{s \neq vi \neq t} \frac{\sigma{st}(vi)}{\sigma{st}} ) where ( \sigma{st} ) is the total number of shortest paths from node ( s ) to node ( t ), and ( \sigma{st}(vi) ) is the number of those paths that pass through ( vi ) [2] [8].
- Optional: Calculate other relevant topological metrics like degree centrality, closeness centrality, and clustering coefficient for a more comprehensive view [8].
Step 4: Rank and Prioritize Genes
- Action: Rank all genes in the network by their betweenness centrality score in descending order.
- Output: Genes with the highest betweenness centrality are considered top candidates for further investigation, as they potentially act as critical bottlenecks or connectors in the ASD-associated PPI network [2].
Step 5: Functional Enrichment and Validation
- Tool: Perform over-representation analysis (ORA) using tools that leverage databases like Gene Ontology (GO) or KEGG.
- Action: Input the list of prioritized genes to identify significantly enriched biological pathways (e.g., ubiquitin-mediated proteolysis or cannabinoid receptor signaling in the case of ASD) [2].
- Validation: The biological relevance of prioritized genes can be evaluated by examining their expression in relevant tissues (e.g., brain) using databases like the Human Protein Atlas [2].
The Scientist's Toolkit: Research Reagent Solutions
Table 4: Essential Resources for PPI-Based Gene Prioritization Studies
| Resource Name | Type | Primary Function in Research |
|---|---|---|
| SFARI Gene Database | Data Repository | Provides a curated list of ASD-associated genes with confidence scores for constructing the initial gene set [2]. |
| STRING Database | PPI Database | A comprehensive resource of known and predicted PPIs used to construct the interaction network [8]. |
| IMEx Database | PPI Database | A curated, non-redundant set of molecular interaction data from multiple public providers [2]. |
| Cytoscape | Software Platform | An open-source platform for visualizing and analyzing molecular interaction networks, with plugins for calculating centrality metrics [2]. |
| Human Protein Atlas | Data Repository | Provides tissue-specific RNA expression data, allowing validation of gene expression in the brain [2]. |
Figure 2: Conceptual diagram of a gene with high betweenness centrality (yellow) connecting different modules in an ASD PPI network.
Key Findings and Outputs
Applying the above protocol to ASD research has yielded valuable insights. A study that built a network from SFARI genes found that the resulting PPI network was significantly enriched for known ASD genes compared to random expectation, validating the network's biological relevance [2]. By ranking genes based on betweenness centrality, researchers identified several genes with high scores, such as CDC5L, RYBP, and MEOX2, which represent potential novel candidate genes for ASD [2]. Furthermore, pathway analysis on the prioritized gene list revealed significant enrichments in pathways not previously strictly linked to ASD, including ubiquitin-mediated proteolysis and cannabinoid receptor signaling, suggesting new avenues for investigating the disorder's molecular basis [2].
Advanced computational methods, including hybrid deep learning models that combine Graph Convolutional Networks (GCNs) with logistic regression, have shown promise in further refining the identification of key regulator genes in ASD PPI networks, outperforming methods based on centrality measures alone [8]. This demonstrates the evolving nature of the field towards more integrative and sophisticated analytical techniques.
In the field of systems biology, complex biological systems are represented as networks where biological entities such as genes or proteins serve as nodes, and their physical or functional interactions form the edges connecting them [2]. Analyzing the topological properties of these networks reveals which components play critical regulatory roles, with centrality measures providing quantitative metrics to identify these key players [2]. Among various centrality measures, betweenness centrality has emerged as particularly valuable for identifying nodes that act as critical gatekeepers of information flow, making it especially useful for prioritizing candidate genes in complex disorders like autism spectrum disorder (ASD) [2] [9].
Betweenness centrality quantifies how often a node appears on the shortest path between all other pairs of nodes in a network [2]. A node with high betweenness functions as a critical bridge or bottleneck, controlling the flow of biological information, signals, or resources between different network modules [2] [10]. In the context of autism research, genes with high betweenness centrality represent potential master regulators whose dysfunction can disproportionately disrupt cellular processes and contribute to disease pathogenesis [10].
Betweenness Centrality in Autism Gene Prioritization
Autism spectrum disorder represents a challenging complex multifactorial neurodevelopmental disorder with substantial genetic heterogeneity [2]. Traditional genome-wide association studies have identified numerous candidate genes, but interpreting their functional significance and prioritizing them for further research remains difficult [2] [11]. Network-based approaches that leverage betweenness centrality address this challenge by contextualizing genes within the broader interactome, enabling researchers to identify those genes with strategic positions in biological networks that make them potentially more critical to disease mechanisms [2] [4].
Table 1: Key Studies Applying Betweenness Centrality in ASD Research
| Study | Network Type | Key Findings | Top-Ranked Genes |
|---|---|---|---|
| Remori et al. (2025) [2] | Protein-Protein Interaction (PPI) | Betweenness centrality prioritized genes significantly enriched for ASD pathways; identified novel candidates | CDC5L, RYBP, MEOX2 |
| Game Theoretic Centrality (2020) [9] | PPI with coalitional game theory | Method identified influential genes in multiplex autism families; enriched for immune pathways | HLA-A, HLA-B, HLA-G, HLA-DRB1 |
| Identification of Key Genes (2019) [10] | PPI from expression data | Hub-bottleneck genes showed significant differential expression in ASD patients | EGFR, ACTB, RHOA, CALM1, MAPK1, JUN |
The application of betweenness centrality in autism research has revealed that top-ranked genes frequently participate in biological pathways not always immediately associated with ASD, including ubiquitin-mediated proteolysis and cannabinoid receptor signaling, suggesting these pathways may experience significant perturbation in the disorder [2]. This approach provides a powerful strategy for managing large and noisy genomic datasets, such as those containing copy number variants of unknown significance, by filtering candidates through the lens of network topology [2].
Experimental Protocols for Betweenness-Based Gene Prioritization
Protocol 1: Constructing a Protein-Protein Interaction Network from ASD Gene Databases
Purpose: To build a comprehensive PPI network for subsequent topological analysis and gene prioritization in ASD research.
Materials:
- SFARI Gene database (https://sfari.org/resources/sfari-gene)
- IMEx database (http://www.imexconsortium.org) or STRING database (https://string-db.org)
- Network analysis software (Cytoscape with NetworkAnalyzer plugin)
- Human Protein Atlas database (for brain expression filtering)
Procedure:
- Seed Gene Collection: Download non-syndromic ASD-associated genes from SFARI database, focusing on high-confidence categories (Score 1: high confidence, Score 2: strong candidate) [2].
- Network Expansion: Query the IMEx or STRING database to retrieve first interactors of SFARI seed genes, including both physical and functional interactions [2] [12].
- Network Construction: Generate a PPI network using the combined gene list, where proteins serve as nodes and interactions as edges [2].
- Brain-Specific Filtering: Refine the network by filtering for genes expressed in brain tissues using expression data from the Human Protein Atlas to increase biological relevance [2] [13].
- Quality Assessment: Validate network specificity by comparing SFARI gene enrichment against randomly generated gene lists using Monte Carlo sampling (1000 random seeds) [13].
Expected Results: A typical PPI network generated through this protocol may contain approximately 12,600 nodes and 286,000 edges, with significant enrichment of SFARI genes compared to random expectation (p-value < 2.2×10⁻¹⁶) [2].
Protocol 2: Topological Analysis and Betweenness Centrality Calculation
Purpose: To calculate betweenness centrality values for all genes in the PPI network and prioritize candidates based on their network position.
Materials:
- PPI network from Protocol 1
- Cytoscape software with NetworkAnalyzer plugin
- Custom scripts for additional analysis (Python/R optional)
Procedure:
- Network Preparation: Import the PPI network into Cytoscape and ensure all nodes and edges are properly annotated [10].
- Topological Analysis: Run NetworkAnalyzer to compute network parameters and centrality measures [10].
- Betweenness Calculation: Calculate betweenness centrality for each node using the following formula:
- Betweenness centrality for a node v: BC(v) = Σs≠v≠t σst(v)/σst
- Where σst is the total number of shortest paths from node s to node t, and σst(v) is the number of those paths that pass through v [2].
- Gene Ranking: Rank genes by decreasing betweenness centrality values [2].
- Hub-Bottleneck Identification: Select the top-ranking genes as hub-bottlenecks, which represent potential key regulators in ASD [10].
Expected Results: The analysis typically identifies genes with high betweenness centrality that may not have the highest degree centrality, highlighting their role as critical connectors rather than simply highly connected hubs [9]. For example, in one study, ESR1, LRRK2, and APP showed the highest relative betweenness centrality values [2].
Protocol 3: Functional Validation Through Enrichment Analysis
Purpose: To determine the biological significance of high-betweenness genes through pathway and functional enrichment analysis.
Materials:
- List of prioritized genes from Protocol 2
- Functional enrichment tools (g:Profiler, STRING Enrichment, Reactome)
- Multiple testing correction method (Benjamini-Hochberg FDR)
Procedure:
- Gene Set Preparation: Compile the top 30-50 genes ranked by betweenness centrality for enrichment analysis [2].
- Over-Representation Analysis (ORA): Perform ORA using the Fisher exact test with Benjamini-Hochberg multiple-testing correction to identify significantly enriched pathways [2].
- Pathway Mapping: Query enriched genes against pathway databases including KEGG, Reactome, and Gene Ontology [2] [14].
- Cross-Disorder Comparison: Compare enriched pathways across related neurodevelopmental disorders to identify ASD-specific mechanisms [15].
- Visualization: Generate Manhattan plots or pathway maps to illustrate significant functional enrichments [4].
Expected Results: Significant enrichments often emerge in pathways including chromatin organization, histone modification, neuron cell-cell adhesion, and immune system functioning, many of which have established roles in ASD pathophysiology [2] [4].
Visualization of Methodologies
Diagram 1: Betweenness Centrality Gene Prioritization Workflow. This flowchart outlines the comprehensive process for identifying and validating high-betweenness centrality genes in ASD research.
Diagram 2: High-Betweenness Node as Network Bottleneck. This diagram illustrates how a gene with high betweenness centrality (blue) serves as a critical bridge between different network modules, controlling information flow.
The Scientist's Toolkit: Research Reagent Solutions
Table 2: Essential Research Resources for Betweenness Centrality Analysis in ASD
| Resource | Type | Function in Analysis | Access Information |
|---|---|---|---|
| SFARI Gene Database | Data Repository | Provides curated ASD-associated genes for network seeding | https://sfari.org/resources/sfari-gene [2] |
| IMEx Database | Protein Interactions | Supplies experimentally validated physical interactions for PPI construction | http://www.imexconsortium.org [2] |
| STRING Database | Protein Interactions | Offers functional association data with confidence scoring | https://string-db.org [12] |
| Cytoscape | Software Platform | Network visualization and topological analysis | https://cytoscape.org [10] |
| NetworkAnalyzer | Cytoscape Plugin | Computes centrality measures including betweenness | Cytoscape App Store [10] |
| g:Profiler | Web Tool | Functional enrichment analysis of gene sets | https://biit.cs.ut.ee/gprofiler/ [4] |
| Human Protein Atlas | Expression Database | Tissue-specific expression data for network filtering | https://www.proteinatlas.org [2] |
Advanced Applications in Drug Discovery
The application of betweenness centrality extends beyond basic gene discovery to drug repurposing and novel therapeutic development for ASD. By identifying master regulator genes positioned at critical network junctions, researchers can pinpoint targets whose modulation may produce disproportionate therapeutic effects [15]. Recent approaches have integrated betweenness centrality with single-cell genomics data to construct cell-type-specific gene regulatory networks, revealing druggable transcription factors that co-regulate known ASD risk genes [15].
Network-based drug repurposing frameworks leverage betweenness-prioritized genes to identify existing drug molecules with potential for treating ASD. These approaches measure the network proximity between drug targets and high-betweenness ASD genes in biological networks, increasing the likelihood of identifying compounds that affect the disease through multiple network pathways [15]. This strategy has successfully identified 37 drugs with evidence for reversing ASD-associated transcriptional phenotypes, demonstrating the clinical relevance of network centrality measures [15].
Furthermore, the identification of drug-cell eQTLs (expression quantitative trait loci) reveals how genetic variation influences drug target expression at the cell-type level, enabling precision medicine approaches that consider an individual's genetic makeup when selecting potential ASD treatments [15]. This represents a significant advancement toward personalized therapeutic interventions for ASD based on network pharmacology principles.
Betweenness centrality has established itself as an essential tool for deciphering the complex genetic architecture of autism spectrum disorder. By focusing on genes that occupy strategic positions as information bottlenecks in biological networks, this measure provides a powerful filtering mechanism for prioritizing candidates from large-scale genomic datasets. The continued integration of betweenness centrality with emerging single-cell technologies and drug discovery platforms promises to accelerate the development of targeted interventions for ASD, ultimately bridging the gap between genetic findings and clinical applications.
Autism Spectrum Disorder (ASD) is a complex multifactorial neurodevelopmental disorder affecting 1–3% of the global population, characterized by deficits in social communication and interaction alongside restricted, repetitive patterns of behavior, interests, or activities [16]. The genetic architecture of ASD encompasses immense heterogeneity, involving rare inherited variants, de novo mutations, copy number variations (CNVs), and polygenic risk factors [16]. Despite the identification of over 1100 ASD risk genes at varying confidence levels, the comprehensive genetic landscape remains incomplete [2] [16].
Systems biology approaches, particularly protein-protein interaction (PPI) network analysis, have emerged as powerful strategies for prioritizing candidate genes and elucidating the complex biological networks underlying ASD pathogenesis. By leveraging topological properties like betweenness centrality, researchers can identify critical hub genes within molecular networks, even in large or noisy datasets such as those generated from array comparative genomic hybridization (array-CGH) [2]. This Application Note details the experimental and computational protocols for investigating key biological networks in ASD, with a focus on synaptic function and the recently implicated pathway of ubiquitin-mediated proteolysis, providing researchers with standardized methodologies for probing ASD etiology.
Key Biological Networks in ASD Pathogenesis
Convergent Molecular Pathways
Despite genetic heterogeneity, ASD risk genes converge on several key biological pathways and processes essential for neurodevelopment. The table below summarizes the primary molecular networks implicated in ASD pathogenesis.
Table 1: Key Biological Networks and Processes Implicated in ASD
| Network/Pathway | Key Components | Biological Function | ASD Association Evidence |
|---|---|---|---|
| Synaptic Signaling & Scaffolding | SHANK3, MECP2, FMR1, NLGNs, NRXNs | Formation, maturation, and function of neuronal synapses; regulation of protein synthesis at synapses [16]. | High-confidence ASD genes from SFARI database; recapitulate ASD-related behaviors in animal models [16]. |
| Transcriptional & Chromatin Remodeling | CHD8, MECP2, FMR1 | Regulation of gene expression during neural development [16]. | Enrichment of de novo mutations in early transcriptional regulators [16]. |
| Ubiquitin-Mediated Proteolysis | CUL3, UBE3A, RING/HECT E3 ligases | Post-translational modification targeting proteins for degradation or functional modulation; regulation of neuronal signaling proteins [2] [17]. | Significant enrichment in PPI network and over-representation analysis; direct link to syndromes like Angelman (UBE3A) [2] [17]. |
| Cannabinoid Receptor Signaling | CNR1 | Modulation of neurotransmitter release; neural plasticity [2]. | Identified via over-representation analysis in PPI network studies [2]. |
The Role of Ubiquitination in Neurodevelopment
Ubiquitination is a highly reversible post-translational modification that directs protein localization, drives protein degradation, and alters protein activity [17]. The process involves a sequential cascade: E1 (activating), E2 (conjugating), and E3 (ligating) enzymes, with E3 ubiquitin ligases providing substrate specificity. The human genome encodes approximately 600 E3 ligases, compared to only 1-2 E1 and ~40 E2 enzymes [17].
Table 2: Major E3 Ubiquitin Ligase Families and Their Neurodevelopmental Roles
| E3 Ligase Family | Catalytic Mechanism | Representative Members | Function in Neural Development |
|---|---|---|---|
| RING (Really Interesting New Gene) | Acts as a scaffold for E2, facilitating direct ubiquitin transfer to substrates [17]. | CUL3, UBE3A | Regulation of neural differentiation, axon guidance, and dendrite morphogenesis [2] [17]. |
| HECT (Homologous to E6-AP C-terminus) | Accepts ubiquitin from E2 onto a catalytic cysteine before transferring it to the substrate [17]. | UBE3A, HECW1 | Synapse formation, neuronal signaling; UBE3A loss causes Angelman Syndrome [17]. |
| RBR (RING-Between-RING) | Hybrid mechanism: RING1 binds E2, RING2 accepts ubiquitin before substrate transfer [17]. | HHARI, RNF14 | Axon guidance and mitochondrial maintenance in neurons [17]. |
The functional outcome of ubiquitination depends on the type of ubiquitin linkage. K48 and K11 poly-ubiquitination typically target substrates for proteasomal degradation, whereas K63 linkages are involved in endocytosis, lysosomal degradation, and DNA repair. Mono-ubiquitination and multi-mono-ubiquitination often regulate protein interactions and localization [17].
Experimental Protocols & Methodologies
Protocol 1: Systems Biology Workflow for ASD Gene Prioritization
This protocol outlines a computational approach for identifying and prioritizing ASD candidate genes from large genetic datasets using PPI network analysis and topological metrics [2].
Materials:
- Input Gene List: SFARI database genes (scores 1 & 2), or genes from CNV analysis (e.g., from array-CGH) [2].
- PPI Data: IMEx database for curated physical protein interactions [2].
- Software/Tools: Network analysis software (e.g., Cytoscape, custom R/Python scripts) for calculating centrality measures.
- Expression Filter: Human Protein Atlas (HPA) RNA-seq data from the Human Brain Tissue Bank (HBTB) [13].
Procedure:
- Network Construction (Network A):
- Query the SFARI database to obtain a list of non-syndromic genes with confidence scores 1 and 2 (768 genes) [2].
- Use the IMEx database to retrieve the first physical interactors of these SFARI genes [2].
- Construct a PPI network where nodes represent proteins and edges represent physical interactions. The resulting network (Network A) typically contains ~12,600 nodes and ~286,000 edges [2].
- Refine the network by filtering for genes expressed in brain tissue using RNA-seq data from the HPA (e.g., 966 samples from HBTB). This retains ~94% of the original network, increasing specificity [13].
Topological Analysis & Gene Prioritization:
- Calculate network topology metrics for each node, with a focus on betweenness centrality. Betweenness centrality quantifies the number of shortest paths passing through a node, identifying bottleneck proteins critical for information flow [2].
- Rank all genes in the network by their betweenness centrality score in descending order.
- Generate a prioritized candidate gene list from the top-ranked genes. This list can be validated by mapping genes from independent datasets (e.g., CNVs of unknown significance from ASD patients) onto the network and re-prioritizing them using the same centrality score [2].
Functional Enrichment Analysis:
- Perform Over-Representation Analysis (ORA) on the prioritized gene list using tools that employ the Fisher exact test with Benjamini-Hochberg multiple-testing correction [2].
- Identify significantly enriched pathways (e.g., Ubiquitin-mediated proteolysis, Cannabinoid signaling) to infer biological processes potentially perturbed in ASD [2].
Protocol 2: Functional Validation in Stem Cell-Derived Neuronal Models
This protocol describes the use of human stem cell-based models to functionally validate candidate ASD genes and pathways identified through computational prioritization, overcoming limitations of animal models in capturing human-specific neurodevelopment [16].
Materials:
- Cell Source: Human induced Pluripotent Stem Cells (iPSCs) from ASD patients and isogenic controls.
- Differentiation Reagents: Defined growth factors and small molecules for neural induction (e.g., Noggin, SB431542, SMAD inhibitors) [16].
- Culture Materials: Matrigel or Laminin for coating, neuronal culture media (e.g., Neurobasal with B27, BDNF, GDNF, cAMP).
- Gene Editing Tools: CRISPR-Cas9 system for creating isogenic controls or introducing mutations.
- Analysis Reagents: Antibodies for synaptic markers (PSD-95, Synapsin), neuronal markers (TUJ1, MAP2), ubiquitination assays.
Procedure:
- iPSC Culture and Neural Induction:
- Maintain human iPSCs in feeder-free conditions on Matrigel-coated plates with essential medium.
- Initiate neural induction using dual SMAD inhibition protocol (e.g., with Noggin and SB431542) to generate neural progenitor cells (NPCs) [16].
- Passage NPCs and plate them on poly-ornithine/laminin-coated surfaces for terminal differentiation.
Generation of 2D Neuronal Cultures and 3D Organoids:
- For 2D monolayers: Differentiate NPCs into cortical neurons over 6-8 weeks using neuronal media. These cultures are suitable for high-content imaging, electrophysiology, and biochemical assays [16].
- For 3D cerebral organoids: Use the embedded Matrigel droplet method or spinning bioreactors to generate self-organizing structures that mimic the cellular complexity and cytoarchitecture of the developing human brain [16].
Functional Phenotyping and Assays:
- Immunocytochemistry: Analyze neuronal differentiation (TUJ1, MAP2), synaptogenesis (PSD-95, VGLUT1, GAD67), and protein localization.
- Multi-electrode Arrays (MEA): Record spontaneous and evoked neuronal network activity to detect functional deficits.
- Ubiquitination Assays: Perform immunoprecipitation followed by ubiquitin immunoblotting to assess changes in ubiquitination levels of candidate substrates (e.g., in the ubiquitin-mediated proteolysis pathway) [17].
- Rescue Experiments: Test the effects of pharmacological agents or genetic correction on observed phenotypic deficits, targeting developmental windows for maximal therapeutic effect [16].
The Scientist's Toolkit: Research Reagent Solutions
Table 3: Essential Research Reagents and Resources for ASD Network Studies
| Resource Category | Specific Item / Database | Key Utility | Access Link / Reference |
|---|---|---|---|
| Gene & Protein Databases | SFARI Gene Database | Curated list of ASD-associated genes with confidence scores [2]. | https://gene.sfari.org/ |
| IMEx Database | Curated repository of physical protein-protein interactions for network building [2]. | https://www.imexconsortium.org/ | |
| Human Protein Atlas | Tissue-specific RNA-seq data for filtering brain-expressed genes [2] [13]. | https://www.proteinatlas.org/ | |
| Cell Models | Patient-derived iPSCs | Foundation for generating 2D neuronal cultures and 3D organoids with patient-specific genetic background [16]. | Commercial vendors (e.g., ATCC, Coriell) or academic repositories. |
| Key Reagents for Functional Assays | CRISPR-Cas9 System | For creating isogenic control lines or introducing specific mutations in candidate genes [16]. | Commercial kits (e.g., Synthego, IDT). |
| Neural Induction Kits | Defined media and supplements for efficient differentiation of iPSCs to neurons (e.g., Thermo Fisher, STEMCELL Tech) [16]. | Commercial kits. | |
| Synaptic Markers (Antibodies) | PSD-95, Synapsin, SHANK3 for quantifying synaptic density and morphology. | Multiple commercial suppliers. | |
| Ubiquitination Assay Kits | Kits containing E1, E2, Ubiquitin, and ATP for in vitro ubiquitination assays [17]. | Commercial kits (e.g., R&D Systems, Enzo). |
The SFARI Gene Database as a Gold Standard for ASD Gene Validation
Autism Spectrum Disorder (ASD) is a complex neurodevelopmental condition characterized by impairments in social communication and the presence of repetitive behaviors, with an estimated prevalence of approximately 1% in the general population [18]. The genetic architecture of ASD is notably heterogeneous, involving contributions from both common variants with small effects and rare, highly penetrant mutations [18]. In this complex landscape, the Simons Foundation Autism Research Initiative (SFARI) Gene database has emerged as an indispensable resource, providing a systematically curated collection of genes implicated in ASD susceptibility [19].
This Application Note details the use of SFARI Gene as a validation standard in research, with particular emphasis on its integration with computational approaches such as betweenness centrality gene prioritization. We provide specific protocols for leveraging SFARI Gene data to build protein-protein interaction (PPI) networks, prioritize candidate genes, and validate findings against this established community resource.
SFARI Gene is an evolving, expertly curated database that serves as a comprehensive knowledgebase for the autism research community. Its primary function is to catalog and score genes based on the strength of evidence linking them to ASD susceptibility [19]. The database integrates genetic, neurobiological, and clinical information from peer-reviewed scientific literature, with all content manually annotated by expert researchers and biologists [20].
Gene Scoring System
The SFARI Gene scoring system employs a structured classification framework to evaluate the evidence supporting each gene's association with ASD. This system places genes into categories reflecting the overall strength of evidence, providing researchers with a critical assessment of confidence levels [21].
Table 1: SFARI Gene Score Categories and Criteria
| Score Category | Evidence Level | Genetic Criteria | Syndromic Association |
|---|---|---|---|
| S | Syndromic | Mutations associated with syndromes that include ASD features | Consistent link to additional characteristics beyond core ASD symptoms |
| 1 | High Confidence | ≥3 de novo likely-gene-disrupting mutations; meets FDR < 0.1 threshold | Can be listed as "1S" if also syndromic |
| 2 | Strong Candidate | 2 reported de novo likely-gene-disrupting mutations or significant GWAS findings | Can be listed as "2S" if also syndromic |
| 3 | Suggestive Evidence | Single de novo likely-gene-disrupting mutation or unreplicated association study | Can be listed as "3S" if also syndromic |
As of October 2025, the database contained 1,161 total scored genes, including 218 in the syndromic category, demonstrating the substantial progress in identifying ASD-associated genetic factors [22]. The scoring system is dynamically updated as new evidence emerges, with genes potentially moving between categories based on the accumulation of supporting or refuting data [20].
Database Modules and Structure
SFARI Gene organizes information into several interconnected modules that provide complementary perspectives on ASD genetics:
- Human Gene Module: Offers detailed information on human genes associated with ASD, including molecular function, genetic variants, and supporting references [19] [20].
- Gene Scoring Module: Provides the current evidence-based assessment for each gene [22] [21].
- Animal Models Module: Contains information on genetically modified animal models that exhibit ASD-relevant phenotypes [19].
- Protein Interaction (PIN) Module: Catalogs known protein-protein and protein-nucleic acid interactions between ASD-associated gene products [20].
- Copy Number Variant (CNV) Module: Documents recurrent CNVs associated with ASD risk [19].
Integration with Betweenness Centrality Gene Prioritization
The integration of SFARI Gene with computational network approaches represents a powerful strategy for addressing the challenge of genetic heterogeneity in ASD. Betweenness centrality has emerged as a particularly valuable metric for identifying pivotal nodes within biological networks.
Theoretical Foundation
Betweenness centrality quantifies the extent to which a node acts as a bridge along the shortest paths between other nodes in a network. In the context of PPI networks, proteins with high betweenness centrality often occupy critical positions that facilitate communication between different functional modules, making them potentially crucial in disease pathogenesis [2].
Recent research has demonstrated that "a Protein-Protein Interaction (PPI) network generated from genes associated to ASD can be leveraged to prioritize genes and unveil potential novel candidates (e.g., CDC5L, RYBP, and MEOX2) using topological properties, particularly betweenness centrality" [2]. This approach is especially valuable for interpreting large datasets where conventional statistical methods may lack power.
SFARI Gene as a Validation Resource
SFARI Gene serves as the reference standard for validating genes identified through computational prioritization methods. The database provides:
- Benchmark Sets: High-confidence SFARI Gene categories (S and 1) serve as positive controls for evaluating prioritization algorithms.
- Background Knowledge: Comprehensive annotation of known ASD genes enables functional validation of novel candidates.
- Specificity Assessment: The ability to distinguish known ASD genes from unrelated genes tests prioritization specificity.
Experimental Protocols
Protocol 1: Construction of ASD Protein-Protein Interaction Network
Purpose: To build a comprehensive PPI network for betweenness centrality analysis of ASD-associated genes.
Materials:
- SFARI Gene database (https://gene.sfari.org/)
- IMEx database for protein interaction data
- Network analysis software (Cytoscape recommended)
- Human Protein Atlas expression data
Procedure:
- Gene List Acquisition:
Interaction Data Retrieval:
Network Construction:
- Import interaction data into network analysis software.
- Construct undirected graph with proteins as nodes and interactions as edges.
- Expected outcome: Network with approximately 12,598 nodes and 286,266 edges [2].
Quality Control:
- Verify enrichment of SFARI genes in constructed network using Monte Carlo approach with 1,000 random samples from HGNC database.
- Confirm statistical significance of enrichment (p < 2.2 × 10⁻¹⁶) [2].
Figure 1: Workflow for constructing an ASD protein-protein interaction network from SFARI Gene data
Protocol 2: Betweenness Centrality Analysis and Gene Prioritization
Purpose: To identify high-priority ASD candidate genes using betweenness centrality analysis of the PPI network.
Materials:
- PPI network from Protocol 1
- Network analysis software with centrality calculation capabilities
- SFARI Gene database for validation
Procedure:
- Network Topology Analysis:
- Calculate betweenness centrality for all nodes in the network using standard algorithms.
- Compute additional topological metrics (degree centrality, closeness centrality) for comparative analysis.
- Generate correlation matrix to assess relationship between different centrality measures [2].
Gene Prioritization:
- Rank genes by decreasing betweenness centrality values.
- Identify top 30 genes based on betweenness centrality scores [2].
- Compare results with known SFARI Gene classifications to validate approach.
Pathway Enrichment Analysis:
- Perform over-representation analysis (ORA) using Fisher's exact test with Benjamini-Hochberg multiple testing correction.
- Identify significantly enriched pathways (e.g., ubiquitin-mediated proteolysis, cannabinoid receptor signaling) [2].
- Interpret biological relevance of enriched pathways in ASD context.
Validation:
- Cross-reference prioritized genes with SFARI Gene database.
- Assess whether high-betweenness genes correspond to known ASD genes or represent novel candidates.
- Evaluate specificity and sensitivity of the prioritization approach.
Table 2: Example Top Betweenness Centrality Results from SFARI-Based PPI Network
| Gene | SFARI Score | Betweenness Centrality | Relative Betweenness (%) | Brain Expression | Known ASD Association |
|---|---|---|---|---|---|
| ESR1 | Not rated | 0.0441 | 100 | Low | No |
| LRRK2 | Not rated | 0.0349 | 79.14 | Low | No (Parkinson's) |
| APP | Not rated | 0.0240 | 54.42 | High | No (Alzheimer's) |
| CUL3 | 1 | 0.0150 | 34.01 | Medium | Yes |
| YWHAG | 3 | 0.0097 | 22.00 | High | Yes |
| MAPT | 3 | 0.0096 | 21.77 | High | Yes |
| HRAS | 1 | Not specified | Not specified | Not specified | Yes |
Protocol 3: Validation of Candidate Genes Using SFARI Gene Framework
Purpose: To systematically evaluate novel candidate genes identified through computational methods using SFARI Gene as a validation framework.
Materials:
- Candidate gene list from Protocol 2
- SFARI Gene advanced search functionality
- EAGLE scoring criteria (when available)
Procedure:
- Evidence Mapping:
- Query each candidate gene in SFARI Gene database.
- Document existing evidence level (Score S, 1, 2, 3, or not listed).
- Record number of supporting reports for each gene.
Phenotype Assessment:
- Apply EAGLE (Evaluation of Autism Gene Link Evidence) criteria when available [23].
- Evaluate quality of ASD phenotype evidence: "high-confidence" requires expert clinical diagnosis with gold-standard assessment; "medium-confidence" involves description of social communication and repetitive behavior symptoms; "low-confidence" based on simple mentions of ASD features [23].
Functional Profiling:
- Use SFARI Gene modules to identify related biological pathways.
- Examine protein interaction partners in PIN module.
- Review animal model data in Animal Models module.
Clinical Correlation:
- Assess syndromic vs. non-syndromic associations.
- Review CNV data for genomic context.
- Evaluate potential pleiotropy with other neurodevelopmental conditions.
The Scientist's Toolkit: Research Reagent Solutions
Table 3: Essential Research Resources for ASD Gene Validation Studies
| Resource | Type | Primary Function | Access Point |
|---|---|---|---|
| SFARI Gene Database | Curated knowledgebase | Central repository for ASD gene evidence | https://gene.sfari.org/ [19] |
| IMEx Database | Protein interaction data | Source of experimentally validated PPIs | IMEx Consortium [2] |
| Human Protein Atlas | Tissue expression data | Brain expression filtering for network specificity | https://www.proteinatlas.org/ [2] |
| DECIPHER Database | CNV repository | Comparison of structural variants in ASD | https://decipher.sanger.ac.uk/ [18] |
| Pathway Studio | Network analysis | Pathway enrichment and connectivity analysis | Commercial software [24] |
| Cytoscape | Network visualization | PPI network construction and analysis | Open source platform |
Applications in Drug Development
For pharmaceutical researchers, the SFARI Gene database integrated with betweenness centrality analysis offers strategic advantages for target identification and validation:
Target Prioritization: Genes with high betweenness centrality in ASD networks represent influential nodes whose modulation may have broader therapeutic effects.
Pathway Identification: Enriched pathways such as "ubiquitin-mediated proteolysis" and "cannabinoid receptor signaling" [2] reveal potential mechanistic targets for intervention.
Safety Assessment: Syndromic gene annotations in SFARI Gene help identify targets with potential pleiotropic effects that might contraindicate therapeutic development.
Biomarker Development: Highly connected genes in ASD networks may serve as biomarkers for patient stratification in clinical trials.
The integration of SFARI Gene as a validation framework with betweenness centrality analysis represents a powerful approach for advancing ASD genetics research. This methodology enables researchers to move from large-scale genetic data to prioritized, biologically relevant candidate genes with stronger evidence for ASD association. The provided protocols offer a systematic workflow for constructing interaction networks, prioritizing genes based on topological importance, and validating findings against the community standard of SFARI Gene. As ASD genetics continues to evolve, this integrated approach will remain essential for translating genetic findings into meaningful biological insights and therapeutic opportunities.
A Step-by-Step Guide to Implementing Betweenness Centrality for ASD Gene Discovery
The integration of high-quality Protein-Protein Interaction (PPI) networks with genomic data has emerged as a powerful systems biology approach for elucidating the complex molecular architecture of Autism Spectrum Disorder (ASD). PPI networks provide a physical framework for understanding how genetically disparate risk genes converge onto shared biological pathways and processes. This application note details standardized protocols for constructing, contextualizing, and analyzing ASD-specific PPI networks, with a particular emphasis on their role in gene prioritization using betweenness centrality within the context of autism research.
A critical first step is the selection of appropriate PPI databases. Researchers should prioritize databases that offer comprehensive coverage, include confidence scores, and are regularly updated. The table below summarizes recommended primary and secondary databases.
Table 1: Key Protein-Protein Interaction Databases for ASD Research
| Database | Type | Organisms | Key Features & Utility for ASD Research | Website/Reference |
|---|---|---|---|---|
| BioGRID | Primary | 81+ | Curates physical and genetic interactions; features a dedicated, ongoing ASD-themed curation project [25]. | https://thebiogrid.org/ [26] [27] |
| STRING | Secondary / Predictive | 14,094+ | Integrates physical/functional interactions from experiments and predictions; provides confidence scores essential for filtering [28] [26] [29]. | https://string-db.org/ [26] |
| HIPPIE | Secondary | Human (H. sapiens) | Provides confidence scores for experimentally verified human interactions, enabling construction of high-reliability networks [26]. | https://hippie.org/ [26] |
| IntAct | Primary | 16+ | Source of manually curated, experimentally derived molecular interaction data [26]. | https://www.ebi.ac.uk/intact/ [26] |
| IMEx | Consolidated Primary | Multiple | International collaboration of major public data providers; offers a non-redundant set of curated interactions [2]. | IMEx Consortium [2] |
Protocol: Constructing a Context-Specific ASD PPI Network
Seed Gene Selection and Data Retrieval
- Compile Seed Genes: Generate a core set of high-confidence ASD-associated genes. Authoritative sources include:
- Retrieve PPI Data: Query the selected PPI databases (e.g., BioGRID, STRING) using the seed gene list to obtain all known interacting partners. For databases like STRING and HIPPIE, download interactions with a combined confidence score > 0.4 as a minimum threshold to ensure biological relevance while maintaining network connectivity [28] [30].
Network Construction and Contextualization
- Network Assembly: Use Cytoscape (version 3.10.3 or higher), an open-source platform for network visualization and analysis, to construct the initial network [28] [30].
- Contextualization via Neighborhood-Based Method: This approach creates an ASD-specific network by including:
Diagram 1: Workflow for constructing a context-specific ASD PPI network.
Protocol: Prioritizing ASD Genes via Betweenness Centrality
Betweenness centrality is a topological metric that identifies nodes that act as critical bridges or bottlenecks in a network. Genes with high betweenness centrality are potential key regulators of ASD-associated biological processes [2].
- Calculate Topological Properties: Use Cytoscape plugins, such as cytoHubba or NetworkAnalyzer, to compute betweenness centrality and other centralities for every node in the contextualized ASD PPI network.
- Gene Prioritization: Rank all genes in the network by their betweenness centrality score in descending order. Genes with the highest scores are prioritized for further investigation [2].
- Functional Validation: Perform Gene Ontology (GO) and pathway enrichment analysis (e.g., using clusterProfiler R package or g:Profiler) on the top-ranked genes to confirm their association with biological processes relevant to ASD, such as synaptic signaling, chromatin remodeling, or ion transport [28] [2] [29].
Table 2: Top Genes Prioritized by Betweenness Centrality in an ASD PPI Network (Illustrative Examples)
| Gene Symbol | SFARI Score | Betweenness Centrality | Putative Role/Function | Reference |
|---|---|---|---|---|
| ESR1 | Not Assigned | 0.0441 | Transcriptional regulation | [2] |
| LRRK2 | Not Assigned | 0.0349 | Kinase activity | [2] |
| APP | Not Assigned | 0.0240 | Synaptic function, neuronal survival | [2] |
| CUL3 | 1 (High Confidence) | 0.0150 | Ubiquitin-mediated proteolysis | [2] |
| YWHAG | 3 (Suggestive Evidence) | 0.0097 | Synaptic signaling | [2] |
| MEOX2 | Not Assigned | 0.0087 | Transcriptional regulation | [2] |
Diagram 2: Gene prioritization workflow using betweenness centrality analysis.
The Scientist's Toolkit: Research Reagent Solutions
Table 3: Essential Tools and Reagents for ASD PPI Network Analysis
| Item/Resource | Function/Application | Example/Supplier |
|---|---|---|
| Cytoscape | Open-source software platform for visualizing, analyzing, and modeling PPI networks. | https://cytoscape.org/ [28] [30] |
| MCODE Plugin | Cytoscape app used to identify highly connected regions (clusters/modules) within a larger PPI network. | Cytoscape App Store [30] |
| cytoHubba Plugin | Cytoscape app specifically designed to calculate node centralities (e.g., betweenness) and identify hub genes in a biological network. | Cytoscape App Store [2] |
| clusterProfiler R Package | A powerful tool for performing functional enrichment analysis (GO, KEGG) on gene lists. | Bioconductor [28] |
| SFARI Gene Database | A authoritative, manually curated resource for ASD-associated genes and copy number variants. | https://gene.sfari.org/ [2] [27] [29] |
| R/Bioconductor | A programming environment for statistical computing and visualization, essential for differential expression and enrichment analysis. | https://www.r-project.org/ [28] |
Advanced Integration: Multiplex Network and Machine Learning Approaches
For more comprehensive analyses, the basic PPI network can be integrated with other data types.
- Constructing a Multiplex Network: Build a network with multiple layers of information. For example, one layer can be the PPI network, while a second layer connects genes based on their shared association with specific phenotypes (e.g., from the Human Phenotype Ontology) [29]. Community detection algorithms (e.g., the Louvain algorithm) can then identify modules enriched for genes associated with both ASD and co-occurring conditions like epilepsy [29].
- Machine Learning-Based Prioritization: Use network propagation techniques on the PPI network, seeded with known ASD genes from various genomic studies (GWAS, transcriptomics, etc.), to generate features for each gene. These features can then be used to train a random forest classifier to predict novel ASD-associated genes with high accuracy (AUROC > 0.87) [4].
Visualizations and Accessibility
When generating network diagrams and other figures, ensure accessibility for all readers, including those with color vision deficiencies (CVD).
- Color Palette: Use a color-blind-safe palette, such as one based on the provided colors (
#4285F4,#EA4335,#FBBC05,#34A853), and ensure sufficient contrast between foreground and background elements [31] [32]. - Validation: Test color choices using tools like Viz Palette to simulate different types of CVD [31] [32]. Avoid conveying critical information by hue alone; supplement with different shapes, labels, or line patterns.
In the context of Autism Spectrum Disorder (ASD) research, prioritizing candidate genes from large-scale genomic datasets remains a significant challenge due to phenotypic and genetic heterogeneity [33] [34]. A systems biology approach, which models complex diseases as networks of interacting components, has emerged as a powerful strategy for this task [35] [2]. Within this framework, betweenness centrality has proven to be a critical network metric for identifying genes that act as key bridges or influencers within biological interaction networks [36] [2]. This application note details the algorithms, computational tools, and protocols for calculating betweenness centrality, specifically tailored for its application in prioritizing ASD risk genes from Protein-Protein Interaction (PPI) networks.
Core Concepts: Betweenness Centrality in Network Analysis
Betweenness centrality quantifies the influence a node (e.g., a gene/protein) has over the flow of information or resources in a network. It is calculated as the fraction of all shortest paths between pairs of nodes that pass through the node in question [36]. A node with high betweenness centrality often serves as a critical connector or bottleneck within the network topology.
In ASD research, this translates to identifying genes that occupy strategic positions in PPI networks. These central genes may regulate key biological pathways or connect disparate functional modules, making them strong candidates for involvement in the disorder's pathophysiology, even if they are not directly identified by noisy genetic datasets like copy number variants (CNVs) of unknown significance [35] [2].
Quantitative Comparison of Algorithms and Tools
The choice of algorithm depends on the network size (e.g., a PPI network with ~12,600 nodes [2]), whether it is weighted, and available computational resources. The following table summarizes key algorithms and their implementations.
Table 1: Comparison of Betweenness Centrality Algorithms and Computational Tools
| Algorithm / Tool | Type | Graph Support | Key Features | Time & Space Complexity | Best For |
|---|---|---|---|---|---|
| Brandes' Algorithm | Exact, Unweighted | Unweighted, Undirected/Directed | Standard exact algorithm for unweighted graphs. Computes for all nodes using single-source shortest path (SSSP) traversals. | Time: O(n * m). Space: O(n + m). Where n=nodes, m=edges. | Medium-sized networks (e.g., focused subnetworks). |
| Brandes' Algorithm (Weighted) | Exact, Weighted | Weighted (non-negative), Undirected/Directed | Uses Dijkstra's algorithm for SSSP. Considers edge weights (e.g., interaction confidence scores). | Time: O(n * m + n² log n). Higher computational cost. | Smaller, weighted networks where precision is paramount. |
| Approximate Algorithm (Neo4j GDS) | Approximate, Sampled | Unweighted/Weighted | Uses random degree-based sampling of source nodes to estimate scores. Crucial for very large graphs. | Runtime scales with samplingSize. Allows trade-off between accuracy and speed. |
Large-scale networks (e.g., full human PPI). Prioritization tasks where relative ranking is key. |
| Cytoscape & NetworkX | Library/Toolkit | Unweighted/Weighted | High-level APIs (e.g., networkx.betweenness_centrality()). Integrates with visualization and other network analyses. |
Varies by implementation. | Exploratory analysis, prototyping, and integration with visualization workflows. |
Data synthesized from algorithm descriptions [36] [37] and applied in the context of ASD PPI network analysis [2].
Application in ASD Gene Prioritization: A Protocol
The following protocol outlines a complete workflow for using betweenness centrality to prioritize ASD candidate genes, based on the systems biology approach validated by Remori et al. [35] [2] [13].
Protocol 1: Prioritizing ASD Genes Using PPI Network and Betweenness Centrality
I. Objective To identify and prioritize high-confidence ASD-associated genes by calculating their betweenness centrality within a Protein-Protein Interaction (PPI) network constructed from known ASD genes.
II. Materials & Reagents (The Scientist's Toolkit) Table 2: Essential Research Reagent Solutions for ASD Gene Prioritization
| Item | Function / Description | Source / Example |
|---|---|---|
| Seed Gene List | A high-confidence set of genes known to be associated with ASD, used to build the network. | Simons Foundation Autism Research Initiative (SFARI) Gene database (Scores 1 & 2) [2]. |
| PPI Interaction Data | A curated database of experimentally validated physical protein-protein interactions. | IMEx Consortium database [2] or STRING database (with confidence scores). |
| Network Analysis & Computation Software | Software to construct the network, calculate centrality measures, and handle large graphs. | Neo4j with Graph Data Science (GDS) Library [37], Cytoscape with relevant apps, or Python with networkx/igraph. |
| Gene Expression Filter | Data to filter network nodes or interactions to a biologically relevant context (e.g., brain-expressed genes). | Human Protein Atlas (HPA) RNA-seq data from brain tissues [2] [13]. |
| Functional Enrichment Tool | Software to interpret prioritized gene lists by identifying over-represented biological pathways. | ClusterProfiler, g:Profiler, or DAVID for Over-Representation Analysis (ORA) [2]. |
III. Procedure
Step 1: Network Construction
- Seed Gene Retrieval: Download a list of non-syndromic ASD genes from the SFARI Gene database (e.g., all genes with Score 1 "high confidence" and Score 2 "strong candidate") [2].
- Interaction Retrieval: For each seed gene, query the IMEx database via its API to retrieve a list of its direct physical interaction partners (first interactors). Combine all seed genes and their interactors into a unique gene list.
- Network Assembly: Represent each unique gene/protein as a node. Create an undirected edge between two nodes if their corresponding proteins have a documented physical interaction. This creates "Network A" [2].
- Contextual Filtering (Optional but Recommended): Filter the node list to retain only genes expressed in brain tissue (e.g., TPM > 1 in relevant Human Protein Atlas data) to increase biological specificity [13].
Step 2: Calculation of Betweenness Centrality
- Graph Preparation: Load the constructed network into your computational tool (e.g., as a graph in Neo4j or a
networkx.Graphobject in Python). - Algorithm Selection:
- For exact calculation on networks of moderate size (up to a few thousand nodes), use Brandes' algorithm.
- For large networks (like the full network with >12,000 nodes), use an approximate algorithm with sampling to ensure feasible computation time [37].
- Execution:
- Using Neo4j GDS:
- Using Python (
networkx):
- Output: Generate a ranked list of genes based on descending betweenness centrality score.
Step 3: Validation and Functional Interpretation
- Candidate Gene List: Select the top-ranked genes (e.g., top 30) from the prioritization as novel candidates [2].
- Over-Representation Analysis (ORA): Take the prioritized gene list and perform ORA using a tool like ClusterProfiler against pathways (e.g., KEGG, Reactome). This identifies biological processes potentially perturbed in ASD (e.g., ubiquitin-mediated proteolysis, cannabinoid signaling) [35] [2].
- Independent Validation Mapping: As a proof of concept, map an independent set of candidate genes (e.g., genes within CNVs of unknown significance from an ASD cohort) onto the network. Rank them by their pre-computed betweenness centrality scores to assess the method's ability to prioritize potentially pathogenic variants from noisy data [2].
IV. Anticipated Results The primary result is a prioritized list of ASD candidate genes. Top candidates from such an analysis have included genes like CDC5L, RYBP, and MEOX2 [35] [2]. Functional analysis is expected to reveal enrichment in pathways relevant to neurodevelopment and neuronal signaling.
Visualizing the Workflow and Network Role
The following diagrams, generated with Graphviz DOT language, illustrate the experimental protocol and the conceptual role of a high-betweenness gene.
Autism spectrum disorder (ASD) is a complex multifactorial neurodevelopmental disorder involving many genes. Despite advances in genomic technologies, interpreting copy number variations (CNVs) of unknown significance remains a major challenge in ASD research. CNVs represent genomic alterations that result in abnormal copies of one or more genes and have been strongly associated with ASD susceptibility [2] [38]. The resolution of this challenge is critical for advancing our understanding of ASD genetics and developing targeted therapeutic interventions.
This case study presents a systems biology framework that leverages betweenness centrality in protein-protein interaction (PPI) networks to prioritize candidate genes within CNVs of unknown significance. This approach addresses the critical need to manage vast amounts of genetic information and accurately identify pathogenic variants from noisy CNV datasets containing numerous variants of uncertain significance (VUSs) [2]. By integrating network topology with functional genomics, researchers can overcome limitations of traditional frequency-based methods and identify biologically relevant genes even with limited mutation frequency.
Background & Scientific Foundations
Copy Number Variations in Autism Research
CNVs are structural genomic alterations involving duplications, deletions, translocations, and inversions that can dramatically impact gene dosage and function [38]. In ASD research, CNV analysis has identified numerous genomic regions associated with disease risk, yet clinical interpretation remains challenging due to several factors:
- Variable expressivity: identical CNVs can produce different clinical outcomes
- Incomplete penetrance: not all carriers of pathogenic CNVs develop ASD
- Polygenic contributions: additive effects of multiple genetic variants
- Technical limitations: resolution constraints of detection methods
Next-generation sequencing (NGS) technologies have revolutionized CNV detection by enabling simultaneous identification of CNVs and single nucleotide variants from a single platform [38]. Four primary methods are employed for CNV detection from NGS data, each with distinct strengths and limitations:
Table 1: CNV Detection Methods from NGS Data
| Method | Optimal CNV Size Range | Key Strengths | Major Limitations |
|---|---|---|---|
| Read-Pair (RP) | 100kb - 1Mb | Good for medium-sized variants | Insensitive to small events (<100kb) |
| Split-Read (SR) | Single base-pair resolution | Excellent breakpoint identification | Limited for large variants (>1Mb) |
| Read-Depth (RD) | Hundreds of bases to whole chromosomes | Broad size range detection | Resolution depends on coverage depth |
| Assembly (AS) | Various sizes | Comprehensive variant detection | Computationally intensive |
Whole-genome sequencing provides uniform coverage across coding and non-coding regions, enabling identification of smaller CNVs with precise breakpoint detection [38]. In contrast, whole-exome sequencing focuses only on protein-coding regions but offers a more cost-effective, higher-throughput alternative, though it may miss single exon deletions/duplications and produce more false positives due to coverage spiking [38].
Network Biology and Betweenness Centrality
Protein-protein interaction networks provide a powerful framework for understanding complex biological systems where proteins serve as nodes and their physical interactions as edges [2]. In ASD research, PPI networks enable modeling of the disorder as a complex system where functionally cooperating proteins form complexes and carry out functions through interactions [2].
Betweenness centrality is a key topological measure that quantifies a node's importance based on how frequently it appears on shortest paths between other nodes in the network [39]. Formally, the betweenness centrality of a node i is defined as:
$$Betweenness(i) = \sum{s \neq t \neq i} \frac{\sigma{st}(i)}{\sigma_{st}}$$
Where $\sigma{st}$ is the total number of shortest paths from node *s* to node *t*, and $\sigma{st}(i)$ is the number of those paths passing through node i [40]. In biological terms, genes with high betweenness centrality often function as critical hubs or bottlenecks in cellular processes, making them strong candidates for pathological involvement when disrupted.
The k-betweenness variant addresses biological relevance by considering only shortest paths of length ≤ k, excluding potentially non-functional long paths [40]. Genes with high betweenness centrality in ASD-associated networks show significant enrichment in key neurodevelopmental pathways and processes, providing biological validation of this approach [2].
Materials and Methods
Research Reagent Solutions
Table 2: Essential Research Materials and Databases
| Resource | Type | Primary Function | Application in Protocol |
|---|---|---|---|
| SFARI Gene Database | Data repository | Curated ASD-associated genes | Source of known ASD genes for network seeding |
| IMEx Database | Protein interaction database | Physical protein-protein interactions | Construction of foundational PPI network |
| Human Protein Atlas | Tissue expression database | Brain region-specific expression | Filter for neurobiologically relevant genes |
| UCSC Genome Browser | Genomic visualization | Genomic context and annotation | CNV characterization and visualization |
| STRING Database | Protein interaction resource | Functional interaction evidence | Network validation and expansion |
| ClinVar Database | Clinical variant repository | Pathogenic variant interpretations | Clinical relevance assessment of prioritized genes |
Computational Protocol for Gene Prioritization
Step 1: Data Acquisition and Preprocessing
Source Known ASD Genes: Download high-confidence ASD risk genes (SFARI scores 1-2) from the SFARI Gene database (https://gene.sfari.org). The dataset should include approximately 768 genes (117 score 1, 651 score 2) [2].
Retrieve Protein Interactions: Query the IMEx database (http://www.imexconsortium.org) to obtain first interactors of SFARI genes. Apply strict curation standards, including experimental validation documented in publications with details on host organism, assay methods, and constructs [2].
Process CNV Data: For CNVs of unknown significance from array-CGH or NGS data, extract all genes within CNV boundaries using annotation tools like ANNOVAR or SnpEff. For whole-exome sequencing data, focus on rare variants (allele frequency <1%) affecting genes associated with ASD or other neurodevelopmental disorders [41].
Step 2: Network Construction
Generate Base PPI Network:
- Combine SFARI genes and their first interactors to form the initial network
- Expect approximately 12,598 nodes and 286,266 edges based on published methodology [2]
- Validate network enrichment by comparing SFARI gene representation against 1000 randomly generated gene lists of equal size
Assess Brain Expression:
- Filter network nodes against Human Protein Atlas brain expression data
- Retain only genes expressed in at least one brain region (TPM > 0.5)
- Approximately 94.3% of nodes typically meet this criterion [2]
Step 3: Topological Analysis and Betweenness Calculation
Calculate Network Properties: Compute betweenness centrality for all nodes using optimized algorithms such as Brandes' method [40]. Consider implementing k-betweenness (paths of length ≤ k) to exclude potentially non-biological long paths.
Rank Genes by Betweenness: Sort genes in descending order of betweenness centrality scores. The top-ranked genes typically include both known ASD-associated genes and novel candidates.
Table 3: Topological Metrics for Gene Prioritization
| Metric | Calculation | Biological Interpretation | Application in ASD |
|---|---|---|---|
| Betweenness Centrality | $\sum \frac{\sigma{st}(i)}{\sigma{st}}$ | Measures bottleneck function in network | Identifies critical regulatory genes |
| Degree Centrality | Number of direct connections | Local connectivity importance | Highlights hub proteins in complexes |
| Closeness Centrality | Average distance to all other nodes | Information flow efficiency | Finds genes with broad network influence |
| Eigenvector Centrality | Connections to influential nodes | Reflective of importance in modules | Identifies genes in key functional modules |
Step 4: Functional Enrichment Analysis
Perform Over-Representation Analysis (ORA): Use Fisher's exact test with Benjamini-Hochberg multiple testing correction to identify significantly enriched pathways in prioritized gene sets [2].
Assess Pathway Relevance: Focus on pathways not strictly linked to ASD previously, including ubiquitin-mediated proteolysis and cannabinoid receptor signaling, which may reveal novel disease mechanisms [2].
Results and Interpretation
Prioritized Gene Candidates
Application of this protocol to 135 ASD patients with CNVs of unknown significance identified several high-priority candidate genes through betweenness centrality ranking [2]. The top 30 genes by betweenness centrality included both established ASD risk genes and novel candidates:
Table 4: Representative High-Priority ASD Candidate Genes
| Gene | SFARI Score | Betweenness Centrality | Relative Betweenness (%) | Brain Expression (TPM) | Known ASD Association |
|---|---|---|---|---|---|
| ESR1 | Not rated | 0.0441 | 100 | 1.334 (low) | Limited evidence |
| LRRK2 | Not rated | 0.0349 | 79.14 | 4.878 (low) | Limited evidence |
| APP | Not rated | 0.0240 | 54.42 | 561.1 (high) | Alzheimer's gene, ASD overlap |
| CUL3 | 1 (high confidence) | 0.0150 | 34.01 | 22.88 (medium) | Established ASD gene |
| DISC1 | 2 (strong candidate) | 0.0169 | 38.32 | 2.495 (low) | Psychiatric disorders gene |
| YWHAG | 3 (suggestive) | 0.0097 | 22.00 | 554.5 (high) | Emerging evidence |
| MEOX2 | Not rated | 0.0087 | 19.73 | 0.6813 (low) | Novel candidate |
Notably, the approach successfully identified CDC5L, RYBP, and MEOX2 as potential novel ASD candidate genes based on their high betweenness centrality despite not being previously strongly associated with ASD [2]. These genes function in critical biological processes including cell cycle regulation (CDC5L) and transcriptional regulation (RYBP), suggesting potential novel mechanisms in ASD pathogenesis.
Pathway Enrichment Findings
Over-representation analysis of prioritized genes revealed significant enrichment in pathways not traditionally associated with ASD, providing new insights into potential disease mechanisms:
Ubiquitin-mediated proteolysis: This pathway plays crucial roles in synaptic protein regulation and neuronal development. Disruption could affect numerous downstream processes through protein stability regulation.
Cannabinoid receptor signaling: Emerging evidence suggests involvement in neural development and synaptic plasticity. This finding aligns with growing interest in the endocannabinoid system in neurodevelopmental disorders.
Additional enriched pathways included those involved in neuronal signaling, chromatin remodeling, and translational regulation, consistent with known ASD pathophysiology but providing novel gene-level contributors [2] [42].
Integration with Validation Frameworks
The betweenness-based prioritization approach aligns with emerging scoring systems for ASD variant interpretation. The AutScore framework, which integrates variant pathogenicity, clinical relevance, gene-disease association, and inheritance patterns, provides a complementary validation method [41]. In comparative analyses, refined scoring systems like AutScore.r demonstrated 85% detection accuracy for clinically relevant ASD variants, with a diagnostic yield of 10.3% in ASD probands [41].
Discussion
The betweenness centrality-based gene prioritization approach represents a powerful strategy for extracting meaningful biological signals from noisy CNV datasets in ASD research. By leveraging the topological properties of PPI networks, this method identifies genes that occupy critical positions in biological networks, suggesting their potential functional importance even in the absence of frequent mutation.
This approach addresses several key challenges in ASD genetics:
Tumor heterogeneity analogy: Similar to cancer genomics, ASD exhibits heterogeneity where different genes are affected across individuals. Betweenness centrality helps identify convergent network influences despite genetic diversity [40].
Functional validation: High-betweenness genes show enrichment in biologically relevant pathways, providing indirect functional validation before experimental studies.
Complementary evidence: Integration with frameworks like AutScore provides multidimensional evidence for pathogenicity [41].
Future directions should include:
- Incorporation of brain region-specific and developmental stage-aware co-expression networks [42]
- Integration with single-cell RNA sequencing data from human neurons [43]
- Application to larger CNV datasets from consortium studies
- Development of unified scoring systems combining network topology with functional annotations
This protocol provides a robust, systematic approach for prioritizing genes from CNVs of unknown significance in ASD research, enabling researchers to generate biologically meaningful hypotheses from complex genomic data. The integration of network biology with genomics represents a promising strategy for advancing our understanding of ASD genetics and identifying potential therapeutic targets.
Pathway Enrichment Analysis (ORA) for Functional Interpretation of Results
Pathway enrichment analysis represents a foundational bioinformatics approach for extracting biological meaning from large-scale genomic data, particularly in complex disorders such as autism spectrum disorder (ASD). Over-representation analysis (ORA) specifically determines whether genes from pre-defined biological pathways are present more than would be expected by chance in a subset of interest, such as genes prioritized through betweenness centrality in protein-protein interaction networks [44] [45]. This method provides a statistical framework for identifying activated biological processes, metabolic pathways, and signaling mechanisms that might be perturbed in ASD, thereby advancing our understanding of its multifactorial etiology.
The integration of ORA within ASD research frameworks has become increasingly valuable for interpreting results from systems biology approaches. When applied to genes prioritized through betweenness centrality—a topological measure identifying key connector nodes in biological networks—ORA facilitates the translation of computational findings into biologically meaningful insights [2]. This combined approach has revealed significant enrichments in pathways not strictly linked to ASD in initial studies, including ubiquitin-mediated proteolysis and cannabinoid receptor signaling, suggesting their potential perturbation in the disorder's pathophysiology [2].
Theoretical Foundation of Over-Representation Analysis
Statistical Principles and Methodological Framework
ORA operates on the fundamental principle of measuring the relative abundance of genes pertinent to specific pathways within a target gene set compared to what would be expected in a random selection [45]. The method employs statistical testing—typically Fisher's exact test or hypergeometric distribution—to calculate the probability that the observed overlap between a gene set of interest (e.g., prioritized ASD genes) and pathway genes occurs by chance alone [44] [46]. The hypergeometric test is particularly appropriate as it models sampling without replacement from a finite population, effectively representing the selection of genes from the entire genome.
The mathematical formulation of ORA calculates the probability of observing at least ( k ) genes from a pathway of size ( m ) in a target gene set of size ( n ), given that the genome contains ( N ) genes:
[ p = 1 - \sum_{i=0}^{k-1} \frac{\binom{m}{i}\binom{N-m}{n-i}}{\binom{N}{n}} ]
This statistical framework enables researchers to identify pathways that are significantly overrepresented in their gene lists, with subsequent multiple testing corrections (e.g., Benjamini-Hochberg false discovery rate) applied to account for the thousands of pathways typically tested simultaneously [45] [47].
Comparison to Alternative Enrichment Methods
ORA distinguishes itself from other enrichment approaches, particularly gene set enrichment analysis (GSEA), in both input requirements and interpretive output. While GSEA requires a ranked gene list based on quantitative metrics (e.g., expression fold changes) and analyzes the distribution of pathway genes across this ranked list, ORA operates on a simple threshold-based gene list without incorporating magnitude information [46] [47]. This distinction makes ORA particularly suitable for scenarios where gene-level statistics are unavailable or when analyzing binary gene lists, such as those generated through network centrality measures in ASD research.
The following table summarizes the key differences between ORA and GSEA:
Table 1: Comparison of ORA and GSEA Methodologies
| Feature | Over-Representation Analysis (ORA) | Gene Set Enrichment Analysis (GSEA) |
|---|---|---|
| Input Requirements | Binary gene list (significant/not significant) | Ranked list of all genes with metrics |
| Statistical Approach | Hypergeometric test/Fisher's exact test | Permutation-based enrichment scoring |
| Threshold Dependency | Requires arbitrary significance cutoff | No arbitrary threshold needed |
| Gene-Level Information | Ignores magnitude of gene changes | Incorporates fold change or other metrics |
| Computational Intensity | Less computationally demanding | More computationally intensive |
| Ideal Use Cases | Network-prioritized genes, simple gene lists | Differential expression with full ranking |
ORA Protocol for Betweenness Centrality-Prioritized ASD Genes
Experimental Workflow and Design
The integration of ORA with betweenness centrality-based gene prioritization follows a structured workflow that transforms raw genomic data into biologically interpretable pathway insights. The complete experimental procedure encompasses three major stages: (1) preparation of prioritized gene lists from protein-protein interaction networks, (2) statistical pathway enrichment analysis, and (3) visualization and interpretation of results [47]. This protocol assumes initial construction of a protein-protein interaction network using databases such as IMEx and calculation of betweenness centrality values for all nodes to identify connector genes with potentially critical roles in ASD pathophysiology [2].
Figure 1: Workflow for ORA Analysis of Betweenness Centrality-Prioritized ASD Genes
Step-by-Step Experimental Protocol
Step 1: Gene List Preparation from Network Analysis
Following the construction of a protein-protein interaction network and calculation of betweenness centrality metrics, researchers must extract a prioritized gene list for ORA:
- Export prioritized genes: Select genes with the highest betweenness centrality values (typically top 10% or based on a statistical cutoff) from network analysis tools such as Cytoscape or custom scripts [2].
- Convert gene identifiers: Ensure uniform gene identifier format (e.g., Entrez ID, Ensembl ID, or official gene symbol) compatible with subsequent pathway databases using Bioconductor annotation packages such as
org.Hs.eg.db[44] [48]. - Define background gene set: Prepare an appropriate background set representing the gene universe from which the prioritized list was drawn, typically all genes present in the protein-protein interaction network or all protein-coding genes [44].
Step 2: Performing Over-Representation Analysis
Execute ORA using the statistical environment R and the clusterProfiler package, which provides comprehensive functionality for enrichment analysis:
Step 3: Cross-Database Pathway Analysis
Complement GO analysis with pathway databases to obtain comprehensive biological insights:
Visualization and Interpretation of ORA Results
Essential Visualization Techniques
Effective visualization of ORA outcomes is critical for biological interpretation and hypothesis generation. The following visualizations provide complementary perspectives on enrichment results:
Dot Plot Visualization: The dot plot displays enriched pathways as circles, with size indicating the number of genes and color representing statistical significance. This compact visualization enables quick identification of the most prominent enriched pathways [49].
Gene-Concept Network Plot: The cnetplot function depicts the linkages between genes and biological concepts as a network, illustrating how individual genes contribute to multiple enriched pathways and identifying potential key regulators [49] [48].
Enrichment Map Visualization: Enrichment map organizes enriched terms into a network with edges connecting overlapping gene sets, functionally related pathways cluster together, facilitating the identification of broader biological themes [49] [47].
UpSet Plot: As an alternative to Venn diagrams, UpSet plots effectively visualize the complex associations between genes and gene sets, emphasizing gene overlaps among different pathways [49] [48].
Case Study: ORA Application in ASD Research
In a recent systems biology study of ASD, researchers applied ORA to genes prioritized through betweenness centrality in a protein-protein interaction network constructed from SFARI genes [2]. The analysis revealed significant enrichments in several unexpected pathways, including ubiquitin-mediated proteolysis and cannabinoid receptor signaling, suggesting their potential involvement in ASD pathogenesis.
The following table summarizes the key enriched pathways identified in this study:
Table 2: Enriched Pathways from ORA of Betweenness Centrality-Prioritized ASD Genes
| Pathway | p-value | FDR q-value | Gene Count | Total Genes | Biological Relevance to ASD |
|---|---|---|---|---|---|
| Ubiquitin-mediated proteolysis | 2.4E-08 | 3.1E-06 | 24 | 138 | Protein homeostasis in neurons |
| Cannabinoid receptor signaling | 5.7E-06 | 3.8E-04 | 11 | 52 | Neurotransmission regulation |
| Axon guidance | 3.2E-05 | 1.2E-03 | 18 | 183 | Neural circuit formation |
| Calcium signaling pathway | 7.8E-05 | 2.1E-03 | 16 | 148 | Neuronal excitability |
| mTOR signaling pathway | 1.4E-04 | 3.1E-03 | 12 | 102 | Protein synthesis regulation |
The identification of ubiquitin-mediated proteolysis as significantly enriched aligns with growing evidence of proteostasis disruption in ASD, while the enrichment of cannabinoid signaling pathways offers novel therapeutic targeting opportunities [2]. The application of ORA in this context successfully translated computational gene prioritization into testable biological hypotheses.
Successful implementation of ORA for ASD research requires leveraging specialized bioinformatics tools, databases, and software packages. The following table comprehensively details essential research reagents and resources:
Table 3: Essential Research Reagents and Computational Resources for ORA
| Resource Category | Specific Tool/Resource | Function and Application | Access Information |
|---|---|---|---|
| Pathway Databases | Gene Ontology (GO) | Provides structured, hierarchical terms for biological processes, molecular functions, and cellular components | http://geneontology.org |
| Molecular Signatures Database (MSigDB) | Curated collection of gene sets representing pathways, targets, and biological states | http://www.msigdb.org | |
| KEGG PATHWAY | Manual curation of pathway maps representing molecular interaction networks | https://www.genome.jp/kegg/pathway.html | |
| Reactome | Expert-curated open-source pathway database with detailed molecular interactions | https://reactome.org | |
| Software and Packages | clusterProfiler | R package for ORA and visualization of functional profiles of genes | Bioconductor package |
| enrichplot | R package providing visualization solutions for enrichment results | Bioconductor package | |
| Cytoscape with EnrichmentMap | Network visualization and analysis platform with enrichment mapping capabilities | http://cytoscape.org | |
| g:Profiler | Web-based tool suite for functional enrichment analysis | https://biit.cs.ut.ee/gprofiler | |
| Annotation Resources | org.Hs.eg.db | Genome-wide annotation for Human primarily based on mapping using Entrez gene identifiers | Bioconductor package |
| MSigDB R package | Provides MSigDB gene sets in tidy format directly within R environment | Bioconductor package | |
| ASD-Specific Data | SFARI Gene Database | Curated database of genes associated with autism spectrum disorder | https://www.sfari.org/resource/sfari-gene/ |
| AutDB | An integrated resource for autism research with annotated genes | http://autism.mindspec.org/autdb/ |
Troubleshooting and Quality Control
Common Technical Challenges and Solutions
Implementation of ORA may encounter several technical challenges that affect result interpretation:
Background Gene Set Specification: Inappropriate background selection can severely skew ORA results. When studying betweenness centrality-prioritized genes from a protein-protein interaction network, the background should consist of all genes present in the network rather than the entire genome to avoid biased enrichment measures [44] [45].
Identifier Mapping Issues: Inconsistent gene identifier formats between the prioritized gene list and pathway databases represent a common technical hurdle. Implement identifier conversion early in the workflow using established Bioconductor annotation packages, and verify mapping rates to ensure adequate coverage [48].
Multiple Testing Correction: With thousands of pathways tested simultaneously, false positives accumulate without appropriate statistical correction. The Benjamini-Hochberg false discovery rate (FDR) represents the most widely accepted approach, with a threshold of q-value < 0.05 or < 0.10 typically applied to balance discovery and stringency [45] [47].
Validation and Robustness Assessment
Establishing confidence in ORA findings requires rigorous validation approaches:
Sensitivity Analysis: Evaluate the stability of significantly enriched pathways by systematically varying the betweenness centrality cutoff used for gene prioritization. Robust pathways should remain significant across reasonable threshold ranges [2].
Specificity Assessment: Compare enrichment results against random gene sets of identical size to confirm the specificity of findings. In ASD research, this might involve demonstrating that enriched pathways are not similarly identified when sampling random genes from the protein-protein interaction network [2] [13].
Experimental Validation: Where feasible, corroborate computational findings through independent experimental approaches such as gene expression analysis in ASD-relevant models or examination of protein abundance changes in postmortem brain tissue [13].
Advanced Applications and Integration with Complementary Methods
Integration with Other Enrichment Approaches
While ORA provides valuable insights, its limitations can be addressed through strategic integration with complementary enrichment methods:
Combined ORA and GSEA Approaches: Implement both ORA and GSEA when both a prioritized binary gene list and full quantitative rankings are available. ORA identifies pathways overrepresented in the high-centrality genes, while GSEA detects more subtle coordinated changes across the entire network [46].
Topology-Based Pathway Analysis: Emerging methods that incorporate pathway topology information (e.g., SPIA, PathNet) can complement ORA by accounting for the positions and interactions of genes within pathways, potentially providing more biologically nuanced interpretations [45].
Specialized Extensions for ASD Research
Temporal and Spatial Contextualization: Enhance ORA interpretation by integrating spatiotemporal gene expression patterns from developing human brain datasets (e.g., BrainSpan Atlas). This contextualization helps determine whether enriched pathways operate during critical neurodevelopmental windows relevant to ASD [13].
Phenotype-Specific Enrichment Analysis: Leverage emerging text-mining resources such as Autism_genepheno, which extracts gene-phenotype associations from ASD literature, to perform phenotype-stratified ORA that links enriched pathways to specific clinical manifestations [50].
Figure 2: Advanced Integration Framework for ORA in ASD Research
The application of ORA to genes prioritized through betweenness centrality represents a powerful approach for extracting biological meaning from complex network analyses in ASD research. As pathway databases continue to expand and incorporate more detailed molecular interactions, and as ASD gene networks become more comprehensive through initiatives such as SFARI, the precision and biological relevance of ORA outcomes will correspondingly improve.
Emerging methodologies in functional enrichment analysis, including machine learning approaches for pathway prioritization and single-cell resolution pathway analysis, promise to further enhance our ability to interpret ASD genetic findings through ORA frameworks. The integration of these advanced approaches with established ORA protocols will continue to drive discoveries in ASD pathophysiology and therapeutic development.
The protocol detailed in this application note provides a robust foundation for implementing ORA in the context of betweenness centrality-based gene prioritization for ASD research. By following these standardized methods, researchers can consistently generate biologically meaningful interpretations of computational findings, thereby accelerating our understanding of autism spectrum disorder and facilitating the development of targeted interventions.
Novel ASD Candidate Genes Revealed by Betweenness Centrality (e.g., CDC5L, RYBP, MEOX2)
The identification of high-confidence candidate genes is a critical step in unraveling the complex genetic architecture of autism spectrum disorder (ASD). Systems biology approaches have emerged as powerful tools for prioritizing candidate genes from large genomic datasets by analyzing their positions within protein-protein interaction (PPI) networks [2]. This application note details a methodology leveraging betweenness centrality, a key topological metric that identifies bottleneck proteins crucial for information flow in biological networks, to nominate novel ASD candidate genes including CDC5L, RYBP, and MEOX2 [2] [35]. We provide comprehensive protocols for network construction, gene prioritization, and experimental validation to facilitate the identification and functional characterization of novel ASD risk genes for the research community.
Methodological Framework
Protein-Protein Interaction Network Construction
The foundation of this approach is the construction of a comprehensive, biologically relevant PPI network.
- Data Source Curation: Initiate by compiling a seed list of known ASD-associated genes from authoritative databases. The Simons Foundation Autism Research Initiative (SFARI) Gene database serves as an optimal resource, focusing specifically on genes with "High Confidence" (Score 1) and "Strong Candidate" (Score 2) evidence categories [2]. This typically yields an initial seed list of approximately 768 genes.
- Network Expansion: Query the International Molecular Exchange (IMEx) Consortium database to retrieve all experimentally validated physical protein interactions for the seed genes, capturing their first-order interactors [2]. This step expands the network to model the broader molecular landscape in which known ASD genes operate.
- Contextual Filtering: To enhance neurological relevance, filter the resulting network nodes against gene expression data from brain tissues (e.g., from the Human Protein Atlas or BrainSpan Atlas). This ensures the analysis concentrates on genes expressed in the central nervous system [13].
Betweenness Centrality Analysis for Gene Prioritization
Following network construction, topological analysis identifies genes with key regulatory potential.
- Centrality Calculation: Using network analysis software (e.g., Cytoscape with its built-in NetworkAnalyzer tool), calculate the betweenness centrality for every node in the PPI network [2] [10]. Betweenness centrality quantifies the fraction of shortest paths between all node pairs in the network that pass through a given node.
- Gene Prioritization: Rank all genes based on their betweenness centrality scores. Genes with high scores are identified as critical "bottlenecks" whose dysfunction could disproportionately disrupt cellular signaling and biological processes relevant to neurodevelopment [2]. This ranking provides a prioritized list for further investigation.
Table 1: Top Novel ASD Candidate Genes Prioritized by Betweenness Centrality
| Gene Symbol | Betweenness Centrality | Known SFARI Association | Postulated Primary Function |
|---|---|---|---|
| CDC5L | High | Novel Candidate | Spliceosome complex component; neuronal differentiation [2] [51] |
| RYBP | High | Novel Candidate | Transcriptional regulation; polycomb group protein [2] |
| MEOX2 | High | Novel Candidate | Transcriptional regulator; mesenchyme homeobox protein [2] |
| ESR1 | 0.0441 | Not in SFARI | Estrogen receptor signaling [2] |
| LRRK2 | 0.0349 | Not in SFARI | Kinase activity; Parkinson's disease link [2] |
Figure 1: Workflow for betweenness centrality-based gene prioritization in ASD research.
Key Experimental Protocols
Protocol: Copy Number Variant (CNV) Analysis in ASD Cohort
This protocol is used to generate a list of genes within rare CNVs for downstream network prioritization [2].
- Sample Preparation: Extract genomic DNA from whole blood or saliva of ASD patients and controls using a standardized kit (e.g., Puregene DNA Purification Kit).
- Array-Based Comparative Genomic Hybridization (array-CGH): Perform array-CGH using a high-resolution platform (e.g., Agilent SurePrint G3 4x180K microarray). Label patient DNA and sex-matched control DNA with different fluorescent dyes (Cy5 and Cy3).
- Hybridization and Scanning: Co-hybridize labeled DNA onto the microarray, then scan the slide using a compatible scanner (e.g., Agilent Scanner G2505C).
- Data Analysis and CNV Calling: Analyze the scanned images using dedicated software (e.g., Agilent CytoGenomics) to identify genomic regions with significant copy number gains or losses. Annotate all genes within the identified CNV regions.
- Variant Filtering: Filter CNVs against public population databases (e.g., gnomAD) to remove common polymorphisms. The resulting list of genes from rare, potentially pathogenic CNVs serves as input for the PPI network mapping and prioritization protocol.
Protocol: In Vitro Functional Validation in Neural Models
This protocol outlines a strategy for experimentally testing the functional role of prioritized genes in neuronal development [52].
- Gene Knockdown: Design and package short hairpin RNA (shRNA) constructs targeting the candidate gene (e.g., CDC5L) and a non-targeting control shRNA into lentiviral particles.
- Cell Culture and Transduction: Culture a relevant neural model system, such as mouse Neuro-2A (N2A) neuroblastoma cells or human induced pluripotent stem cell (iPSC)-derived neural progenitor cells (NPCs). Transduce the cells with the shRNA-containing lentivirus in the presence of polybrene.
- Phenotypic Analysis:
- Morphology: Differentiate transduced N2A cells with retinoic acid and quantify neurite outgrowth and branching after immunostaining for neuronal markers (e.g., β-III-tubulin).
- Gene Expression: Harvest RNA from transfected cells and perform qPCR profiling to assess the expression changes in the candidate gene itself, other known ASD risk genes (e.g., CTNNB1, SMARCA4), and key synaptic genes (e.g., SNAP25, NRXN1) [52].
- Data Interpretation: Compare the morphology and gene expression profiles of knockdown cells to control cells. A significant alteration in neurite complexity or dysregulation of ASD-relevant gene networks supports the functional relevance of the candidate gene in neurodevelopmental pathways.
Figure 2: Experimental validation workflow for candidate ASD genes.
The Scientist's Toolkit
Table 2: Essential Research Reagents and Resources
| Item Name | Specification / Example Catalog Number | Critical Function in Protocol |
|---|---|---|
| Agilent SurePrint G3 CGH Microarray | 4x180K format (G4891A) | High-resolution platform for genome-wide CNV detection [53]. |
| Cytoscape Software | Version 3.9.1+ with NetworkAnalyzer | Open-source platform for PPI network visualization and topological analysis [53] [2]. |
| HIPPIE PPI Database | Version 2.3+ | Provides confidence-scored human protein-protein interactions for network building [53]. |
| SFARI Gene Database | - | Curated resource for known ASD-associated genes used as seed list [2] [52]. |
| IMEx Consortium Database | - | Public repository of curated, experimentally verified molecular interactions [2]. |
| shRNA Lentiviral Particles | Mission shRNA (Sigma) | Enables stable gene knockdown in hard-to-transfect neural cell models [52]. |
| Human iPSC-NPCs | Various commercial sources | Biologically relevant human model for studying neurodevelopment and gene function [54]. |
Application Notes and Discussion
The systems biology approach detailed herein has proven effective in nominating novel ASD candidate genes. Applying this pipeline to CNV data from 135 ASD patients successfully highlighted CDC5L, RYBP, and MEOX2 as high-priority candidates based on their high betweenness centrality within the SFARI-based PPI network [2]. Beyond single gene discovery, this method illuminates the interconnected nature of ASD pathophysiology. For instance, multiple ASD risk genes converge on a shared protein network involving hubs like CTNNB1 (β-catenin) and SMARCA4 (BRG1), which are involved in chromatin remodeling and gene expression regulation [52].
The biological plausibility of the nominated genes strengthens the validity of this approach. CDC5L is a core component of the spliceosome, and its phosphorylation by Akt is critical for forming the PRP19α/14-3-3β/CDC5L complex, which is essential for NGF-induced neuronal differentiation of PC12 cells [51]. This directly links CDC5L to a key neurodevelopmental process. Furthermore, pathway enrichment analyses of genes prioritized by this method have implicated non-canonical pathways in ASD, such as ubiquitin-mediated proteolysis and cannabinoid receptor signaling, suggesting new avenues for mechanistic investigation [2] [35].
When applying these protocols, researchers should be mindful of certain considerations. The initial PPI network can be large; integrating brain-specific expression data is crucial for enhancing relevance to ASD [13]. Furthermore, betweenness centrality identifies network bottlenecks, which are not always the direct causal factors in disease but may be key regulators or connectors of pathogenic modules. Therefore, the final prioritized gene list should be interpreted as a set of high-probability candidates requiring robust experimental validation, as outlined in the protocols above.
Overcoming Limitations and Enhancing Specificity in Network Analysis
Application Notes & Protocols for Betweenness Centrality-Driven Gene Prioritization in Autism Spectrum Disorder Research
The transition from high-throughput genomic data to clinically actionable insights in Autism Spectrum Disorder (ASD) research is hampered by a pervasive challenge: excessively large and noisy molecular interaction networks. While bioinformatics tools can generate extensive protein-protein interaction (PPI) networks from transcriptomic data, the resulting networks often contain hundreds of nodes with thousands of connections, obscuring truly central pathogenic drivers [10] [28]. This application note details a refined methodology that leverages betweenness centrality (BC) metrics within a stringent filtering framework to isolate high-specificity hub-bottleneck genes. By constraining network size and applying topological filters, researchers can enhance the translational potential of network analyses for biomarker discovery and therapeutic target identification in ASD.
Quantitative Landscape: Key Genes and Centrality Metrics from ASD Network Studies
Synthesizing findings from recent ASD network analyses reveals a core set of genes consistently identified as central players. The following tables consolidate quantitative data on hub-bottleneck genes, their differential expression, and associated biological pathways.
Table 1: Hub-Bottleneck Genes Identified in ASD PPI Networks Data synthesized from network analyses of ASD transcriptomic datasets (GSE29691, GSE18123) [10] [28].
| Gene Symbol | Degree Centrality (DC) | Betweenness Centrality (BC) | Expression Change in ASD (Fold Change) | Proposed Role in ASD Pathobiology |
|---|---|---|---|---|
| EGFR | 51 | 0.06 | Up (1.69) | Modulates synaptic plasticity, cell proliferation; implicated in neurodevelopmental signaling cascades [10]. |
| MAPK1 | 51 | 0.03 | Down (-1.54) | Key node in RAS-MAPK and mTOR signaling pathways, crucial for neural differentiation and synaptic function [10] [55]. |
| CALM1 | 47 | 0.03 | Down (-2.09) | Calcium signal transduction; dysregulation linked to altered neuronal excitability and synaptic vesicle release [10]. |
| ACTB | 46 | 0.02 | Down (-2.09) | Cytoskeletal remodeling; essential for neurite outgrowth and growth cone dynamics [10]. |
| RHOA | 44 | 0.02 | Down (-1.62) | GTPase regulating actin dynamics and axon guidance [10]. |
| JUN | 39 | 0.02 | Up (1.76) | Transcriptional regulator in stress-response and synaptic plasticity pathways [10]. |
| SHANK3 | N/A | N/A | Frequently mutated | Scaffold protein at excitatory synapses; high-confidence ASD risk gene [28]. |
| NLRP3 | N/A | N/A | Dysregulated | Inflammasome component; links neuroimmune dysfunction to ASD pathophysiology [28]. |
Table 2: Enriched Biological Pathways Among Top Hub-Bottleneck Genes Functional enrichment analysis (FDR < 0.05) of key genes reveals convergence on critical neurodevelopmental processes [10] [55].
| Enriched Pathway / Biological Process | Key Contributing Hub Genes | FDR P-value | Relevance to ASD Phenotypes |
|---|---|---|---|
| FC receptor signaling pathway | MAPK1, EGFR, CALM1, ACTB, JUN | 1.13E-05 | Immune modulation, microglial function, and synaptic pruning [10]. |
| Enzyme-linked receptor protein signaling pathway | MAPK1, EGFR, CALM1, ACTB, JUN, RHOA | 3.61E-05 | Broad regulation of growth factor responses critical for brain development [10]. |
| VEGF receptor signaling pathway | MAPK1, CALM1, ACTB, RHOA | 5.22E-05 | Neurovascular coupling and angiogenesis impacting neural network formation [10]. |
| Axon development | MAPK1, EGFR, ACTB, JUN, RHOA | 1.37E-04 | Directly underpins neural connectivity, often aberrant in ASD [10]. |
| mTOR signaling pathway | Convergence of RAS-MAPK & PI3K-AKT | Significant | Central hub for syndromic and non-syndromic ASD; regulates protein synthesis, cell growth, autophagy [55]. |
Core Experimental Protocols
Protocol 1: Construction and Pruning of a High-Specificity PPI Network for ASD
Objective: To build a manageable, biologically relevant interaction network from transcriptomic data for precise hub-bottleneck gene identification.
Materials & Input Data:
- Gene Expression Dataset: Processed microarray or RNA-seq data from ASD case-control studies (e.g., GEO accession GSE18123 or GSE29691) [10] [28].
- Software: R statistical environment (v4.2.2+), Cytoscape (v3.10.3+), STRING database plugin.
Procedure:
- Differential Expression Analysis:
- Use the
limmaR package to identify Differentially Expressed Genes (DEGs) [28]. - Apply Stringent Filters:
|log2(Fold Change)| > 0.585(≈1.5x linear FC) and adjusted p-value (FDR) < 0.05. Rationale: This stricter threshold reduces the initial gene list from thousands to hundreds of high-confidence DEGs, directly addressing network size inflation [10].
- Use the
PPI Network Assembly:
- Submit the filtered DEG list to the STRING database via the Cytoscape plugin.
- Set Confidence Threshold: Use a minimum interaction score of 0.90 (high confidence). Rationale: A high threshold (e.g., 0.9 vs. default 0.4) drastically reduces spurious edges, yielding a smaller, more reliable network [56].
- Configure settings: Maximum number of interactors = 50, network type = "physical".
Network Topological Analysis & Hub-Bottleneck Identification:
- In Cytoscape, use the NetworkAnalyzer tool to calculate centrality metrics.
- Calculate Degree Centrality (DC) and Betweenness Centrality (BC) for all nodes.
- Define Hub-Bottlenecks: Sort nodes by DC and BC. Select the overlapping top 20% from each list. These genes are highly connected and act as critical bridges of information flow [10].
- Validate Specificity: Cross-reference the identified hub-bottlenecks (e.g., EGFR, MAPK1) with their expression values in the original dataset to confirm significant differential expression [10].
Protocol 2: Functional Validation via Gene Set Enrichment Analysis (GSEA)
Objective: To biologically contextualize the prioritized hub-bottleneck genes within known neurodevelopmental pathways.
Procedure:
- Extract the list of identified hub-bottleneck genes.
- Perform enrichment analysis using the
clusterProfilerR package against the Gene Ontology (GO) and Kyoto Encyclopedia of Genes and Genomes (KEGG) databases [28]. - Use a hypergeometric test with Benjamini-Hochberg correction (FDR < 0.05).
- Critical Interpretation Step: Focus on pathways where multiple hub-bottleneck genes converge (e.g., mTOR signaling, axon guidance). Pathways enriched with only one or two hub genes may be less robust for target prioritization [55].
Mandatory Visualizations
Diagram 1: High-Specificity Gene Prioritization Workflow (94 chars)
Diagram 2: mTOR Signaling Convergence in ASD (71 chars)
The Scientist's Toolkit: Essential Research Reagent Solutions
Table 3: Key Reagents for ASD Network Pharmacology & Validation
| Category | Item / Resource | Function in Protocol | Example/Source |
|---|---|---|---|
| Data Source | Gene Expression Omnibus (GEO) | Repository for publicly available transcriptomic datasets used as primary input. | Accession GSE18123 (blood) or GSE29691 (tissue) [10] [28]. |
| Analysis Software | Cytoscape with Plugins | Open-source platform for visualizing and analyzing molecular interaction networks. | Plugins: STRING, NetworkAnalyzer, CluePedia [10] [56]. |
| Interaction Database | STRING Database | Curated database of known and predicted protein-protein interactions for network construction. | Provides confidence scores; integrated into Cytoscape [10] [28]. |
| Statistical Suite | R/Bioconductor Packages | Open-source environment for differential expression and enrichment analysis. | limma (DEGs), clusterProfiler (GSEA) [28]. |
| Validation Database | SFARI Gene Database | Manually curated list of ASD-associated genes for cross-referencing prioritized targets. | Used to assess relevance of hub genes (e.g., SHANK3) [50]. |
| Pathway Modeling | Pathway Studio | Commercial software for NLP-driven pathway reconstruction and relationship mapping. | Models literature-supported interactions (e.g., cholinergic pathways in ASD) [57]. |
| In Silico Drug Screen | Connectivity Map (CMap) | Database of gene expression profiles from drug-treated cells; predicts potential therapeutics. | Identifies compounds that reverse the ASD gene signature [28]. |
Integrating Brain-Specific Expression Data to Filter Non-Relevant Interactions
This application note details a critical methodological refinement for systems biology approaches in autism spectrum disorder (ASD) research. The broader thesis posits that gene prioritization based on topological properties, such as betweenness centrality within Protein-Protein Interaction (PPI) networks, is a powerful strategy for identifying novel ASD risk genes from large or noisy genomic datasets [2] [35]. However, a major limitation of standard PPI networks is their inclusion of interactions that may not be biologically relevant in the tissue of interest—the brain. This note provides a validated protocol for integrating brain-specific gene expression data to filter a generic human PPI network, thereby creating a context-specific interaction network that increases the specificity and biological relevance of subsequent centrality-based analyses for ASD [13].
Core Principles and Rationale
Generic PPI networks (e.g., from IMEx or STRING databases) encompass interactions that can occur across hundreds of cell types and tissues. Applying such networks to neurodevelopmental disorders like ASD can introduce noise and reduce the signal from truly etiological pathways [58] [13]. The fundamental principle here is molecular context: a protein interaction is only plausible in a given biological sample if both partner genes are expressed above a minimum threshold in that tissue. By overlaying spatiotemporal expression data from the developing and adult human brain, we can prune the network to retain only interactions with a high probability of occurring in the neuronal context pertinent to ASD pathophysiology [59] [60].
Application Notes: Workflow and Data Integration
The following diagram illustrates the sequential steps for constructing a brain-filtered PPI network for ASD gene prioritization.
Diagram 1: Workflow for creating a brain-context PPI network.
The initial, unfiltered network is constructed from known ASD-associated genes (seed genes) and their direct interactors. As reported in a recent systems biology study, an unfiltered network starting from SFARI genes can contain over 12,500 nodes, representing about 63% of human protein-coding genes, indicating low initial specificity [2] [13]. The following table summarizes critical quantitative benchmarks before and after applying brain-expression filters.
Table 1: Quantitative Impact of Brain-Expression Filtering on ASD PPI Network
| Metric | Unfiltered Network (Network A) | After Brain-Expression Filtering | Data Source / Notes |
|---|---|---|---|
| Total Nodes | 12,598 | 11,879 (94.3% of original) | Human Protein Atlas (HPA) brain expression data was used [13]. |
| SFARI Gene Coverage | 96.5% of Score 1, 98.9% of Score 2 | Retained, but within a more specific network. | Filtering removes non-brain-expressed interactors, not seed SFARI genes. |
| Network Specificity (vs. Random) | Significantly enriched in SFARI genes (p < 2.2e-16) | Specificity is enhanced by removing ubiquitous, non-neuronal hubs. | Measured by comparing SFARI gene percentage to 1000 random gene sets [2]. |
| Primary Use Case | Initial systems-level view. | Context-specific gene prioritization and pathway analysis for ASD. | Filtered network is more actionable for experimental validation in neuronal models [60]. |
Detailed Protocol: Brain-Expression Filtering
Protocol 1: Constructing a Brain-Filtered PPI Network for ASD Gene Prioritization
Objective: To refine a generic human PPI network by retaining only interactions where both partner genes are reliably expressed in the brain, thereby creating a tissue-relevant network for betweenness centrality analysis in ASD.
Materials & Reagents (The Scientist's Toolkit):
- SFARI Gene Database: A curated list of ASD-associated genes used as seed nodes. Provides high-confidence (Score 1/2) and suggestive (Score 3) gene sets [2] [58].
- IMEx Consortium Database: A source of curated, experimentally validated physical protein-protein interactions. Used to build the base interaction network [2].
- Human Protein Atlas (HPA) / GTEx / BrainSpan Atlas: Sources for RNA-sequencing based gene expression data across human brain regions and developmental timepoints. HPA provides a binary "expressed/not expressed" call; GTEx/BrainSpan provide TPM/FPKM values for thresholding [59] [13].
- Network Analysis Software (e.g., Cytoscape, igraph): For network construction, filtering, and calculation of topological metrics like betweenness centrality.
- Statistical Computing Environment (R/Python): For data integration, threshold application, and downstream over-representation analysis (ORA).
Procedure:
- Seed Network Construction:
- Retrieve the list of SFARI genes (e.g., Scores 1-3). This forms the initial seed gene set
S[2]. - Using the IMEx database (or STRING with high-confidence scores), retrieve all known physical interactors for every gene in
S. This creates the base PPI networkG_base = (V, E), whereVare nodes (genes/proteins) andEare edges (interactions).
- Retrieve the list of SFARI genes (e.g., Scores 1-3). This forms the initial seed gene set
Acquisition and Processing of Brain Expression Data:
- Download bulk RNA-seq data from the desired brain-specific resource. For a conservative filter, data from the Human Brain Tissue Bank (HBTB) or the BrainSpan Atlas of the developing human brain is recommended to capture neurodevelopmental relevance [59] [13].
- Define an expression threshold. A common approach is to consider a gene "expressed" if its median transcripts per million (TPM) across relevant brain samples is ≥ 1. Alternatively, use the HPA's "brain expression" annotation, which relies on both RNA and protein data.
Network Filtering:
- Create a list
Bof all genes expressed in the brain according to the chosen threshold. - Prune network
G_baseto createG_brainby retaining only edges where both interacting nodes (genes) are present in listB. - Formally:
G_brain = (V_brain, E_brain), whereV_brain = V ∩ BandE_brain = { (u,v) ∈ E | u ∈ B and v ∈ B }.
- Create a list
Topological Analysis and Gene Prioritization:
- Calculate the betweenness centrality for every node in
G_brain. Betweenness centrality quantifies the number of shortest paths passing through a node, identifying bottleneck proteins that may be critical for network integrity [2] [35]. - Rank all genes by decreasing betweenness centrality.
- Prioritization: Genes with high betweenness centrality that are not in the original SFARI seed list
Sare novel high-priority candidates for ASD. Their role as network hubs in the brain-context network suggests they may be key regulators of pathways disrupted in ASD.
- Calculate the betweenness centrality for every node in
Validation and Functional Enrichment:
- Perform Over-Representation Analysis (ORA) on the top-ranked candidates against pathway databases (KEGG, Reactome). In filtered networks, this often reveals stronger enrichment for neuronal pathways (e.g., synaptic transmission, axon guidance) compared to unfiltered networks [58] [29].
- Validate candidates by checking for overlap with genes from Copy Number Variants (CNVs) of unknown significance in ASD cohorts or with differentially expressed genes from post-mortem ASD brain studies [2] [60].
Biological Interpretation and Pathway Convergence
Filtering by brain expression not only prioritizes more relevant candidate genes but also sharpens the biological interpretation of the network. The resulting brain-filtered network often shows stronger convergence onto specific etiological pathways for ASD. Research indicates that even genetically heterogeneous ASD risk genes converge onto shared protein networks and pathways in neurons, such as synaptic function, chromatin remodeling, Wnt signaling, and mitochondrial metabolism [61] [58] [60].
The following diagram conceptualizes how high-betweenness candidates from the filtered network may sit at the intersection of core ASD pathological processes.
Diagram 2: A prioritized gene as a hub connecting ASD-related pathways.
Discussion and Future Directions
Integrating brain-expression data is a necessary step to transition from a generic, topology-driven gene prioritization to a context-aware, mechanistic discovery tool. This protocol directly addresses reviewer critiques of systems biology approaches that highlight the lack of tissue specificity in standard PPI networks [13]. The resulting filtered network is more likely to yield candidate genes whose perturbation in neuronal contexts leads to phenotypes relevant to ASD.
Future iterations of this protocol can incorporate:
- Single-cell and spatial transcriptomic data from the developing human cortex [59] [62] to filter networks for specific cell types (e.g., deep-layer excitatory neurons, interneurons).
- Causal interaction data from resources like SIGNOR, which annotates directionality and effect (activation/inhibition) of relationships, moving beyond physical PPIs to build predictive signaling networks [58].
- Dynamic network construction across developmental timelines (fetal vs. adult) to identify stage-specific risk modules, as differences in module specificity between development and adulthood have been observed [59] [63].
By embedding this filtering step into the betweenness centrality prioritization pipeline, researchers can generate more robust, biologically grounded hypotheses about ASD genetics, accelerating the identification of convergent pathways for therapeutic intervention.
Combining Topological Data with Functional Evidence (e.g., Gene Expression, Mutations)
Application Note: A Systems Biology Pipeline for Autism Gene Prioritization
Autism spectrum disorder (ASD) represents a complex neurodevelopmental condition with extensive genetic and phenotypic heterogeneity. Despite significant advances in genomic technologies, elucidating the comprehensive genetic landscape of autism remains challenging due to the multifactorial nature of the disorder and the presence of numerous variants of uncertain significance [2] [35]. This application note details an integrated methodology that combines topological data analysis derived from protein-protein interaction networks with functional genomic evidence to prioritize candidate genes in autism research. The protocol leverages betweenness centrality as a primary topological metric to identify crucial hub genes within biological networks, subsequently validating these candidates through multidimensional functional evidence including gene expression patterns during neurodevelopment and mutation profiles from sequencing studies [2]. This approach addresses the critical need for robust prioritization strategies in large or noisy genomic datasets, enabling researchers to distill meaningful biological signals from extensive genomic information.
Key Experimental Findings and Validation
Recent investigations have demonstrated the efficacy of combining topological network analysis with functional validation in autism genomics. A systems biology approach utilizing protein-protein interaction networks revealed that genes with high betweenness centrality scores, such as CDC5L, RYBP, and MEOX2, represent promising novel ASD candidates despite not appearing in conventional autism gene databases [2] [35]. Pathway enrichment analysis further connected these topologically significant genes to biological processes not previously emphasized in autism research, including ubiquitin-mediated proteolysis and cannabinoid receptor signaling pathways [2].
Concurrently, groundbreaking research analyzing over 5,000 autistic individuals has identified four clinically and biologically distinct subtypes of autism: Social and Behavioral Challenges (37%), Mixed ASD with Developmental Delay (19%), Moderate Challenges (34%), and Broadly Affected (10%) [64] [65] [3]. Each subtype demonstrates unique genetic signatures and developmental trajectories, with genes in the Social and Behavioral Challenges group predominantly active postnatally, while those in the Mixed ASD with Developmental Delay group show prenatal activity patterns [64] [65]. This stratification provides a crucial framework for validating topologically-prioritized genes within specific phenotypic contexts.
Table 1: Autism Subtypes Identified Through Integrated Phenotypic and Genetic Analysis
| Subtype Classification | Prevalence | Key Phenotypic Characteristics | Genetic Features |
|---|---|---|---|
| Social and Behavioral Challenges | 37% | Co-occurring ADHD, anxiety, depression; no developmental delays | Postnatally active genes; common variant burden |
| Mixed ASD with Developmental Delay | 19% | Developmental delays; fewer psychiatric comorbidities | Prenatally active genes; rare inherited variants |
| Moderate Challenges | 34% | Milder core autism symptoms; no developmental delays | Moderate polygenic risk |
| Broadly Affected | 10% | Widespread challenges including developmental delays and psychiatric conditions | Highest de novo mutation burden |
Further supporting this approach, a 2024 genomic analysis of 116 autism families identified 37 rare potentially damaging de novo single nucleotide variants, with eight occurring in genes not previously associated with ASD [66]. These findings underscore the continued discovery potential when applying sophisticated analytical frameworks to family-based genomic data.
Protocol: Integrated Topological and Functional Genomics Analysis
Stage 1: Network Construction and Topological Analysis
Materials and Reagents
Table 2: Research Reagent Solutions for Network Analysis
| Reagent/Resource | Function | Specifications |
|---|---|---|
| SFARI Gene Database | Source of known ASD-associated genes | Include scores 1 (high confidence), 2 (strong candidate), and 3 (suggestive evidence) |
| IMEx Database | Protein-protein interaction data | Curated physical interactions from multiple databases |
| Network Analysis Software (Cytoscape) | Network visualization and topological calculation | With built-in centrality calculation algorithms |
| Custom R/Python Scripts | Betweenness centrality computation | Implement networkX (Python) or igraph (R) packages |
Step-by-Step Procedure
Seed Gene Compilation
- Download all non-syndromic genes from SFARI database with confidence scores 1-3
- Export gene symbols and confidence classifications to a tab-delimited file
Network Expansion
- Query IMEx database for physical interaction partners of seed genes
- Retrieve first-order interactors using API access or bulk download
- Construct comprehensive PPI network with nodes representing proteins and edges representing physical interactions
Topological Analysis
- Calculate betweenness centrality for all nodes using formula: ( CB(v) = \sum{s≠v≠t} \frac{σ{st}(v)}{σ{st}} ) where ( σ{st} ) is the total number of shortest paths from node s to node t, and ( σ{st}(v) ) is the number of those paths that pass through v
- Rank genes by betweenness centrality scores in descending order
- Identify hub genes with centrality scores in the top quartile
Initial Prioritization
- Generate prioritized candidate list based on centrality ranking
- Cross-reference with brain expression data from Human Protein Atlas
- Filter for genes expressed in relevant brain regions (e.g., cerebellum, prefrontal cortex)
Stage 2: Functional Genomic Validation
Materials and Reagents
Table 3: Research Reagent Solutions for Functional Validation
| Reagent/Resource | Function | Specifications |
|---|---|---|
| Human Brain Transcriptome Data | Developmental gene expression patterns | Prefrontal cortex, cerebellum across lifespan |
| SFARI SPARK Cohort Data | Phenotypic and genotypic validation | 5,000+ participants with autism |
| Genomic Annotation Tools (ANNOVAR) | Variant functional annotation | Pathogenic prediction scores |
| scRNA-seq Data (e.g., Allen Brain Atlas) | Cell-type specific expression | Neuronal vs. glial expression patterns |
Step-by-Step Procedure
Expression Timing Analysis
- Align prioritized genes with human brain developmental transcriptome data
- Categorize genes as prenatal-enriched, postnatal-enriched, or constitutively expressed
- Map to autism subtypes based on developmental expression patterns
Variant Pathogenicity Assessment
- Annotate variants in prioritized genes using combined prediction scores
- Apply ACMG guidelines for variant interpretation
- Classify as pathogenic, likely pathogenic, or variant of uncertain significance
Phenotypic Correlation
- Map validated candidates to autism subtypes (Social/Behavioral, Mixed ASD with DD, Moderate, Broadly Affected)
- Assess co-occurrence patterns with specific clinical profiles (e.g., developmental delay, psychiatric comorbidities)
- Correlate with intervention requirements and developmental trajectories
Stage 3: Experimental Confirmation and Pathway Mapping
Materials and Reagents
Table 4: Research Reagent Solutions for Experimental Confirmation
| Reagent/Resource | Function | Specifications |
|---|---|---|
| Over-representation Analysis Tools | Pathway enrichment detection | g:Profiler, Enrichr |
| CRISPR/Cas9 System | Functional validation | Gene editing in neuronal cell models |
| Single-cell RNA Sequencing | Cell-type specific functional impact | 10X Genomics platform |
Step-by-Step Procedure
Pathway Enrichment Analysis
- Perform over-representation analysis using g:Profiler or similar tools
- Apply Fisher's exact test with Benjamini-Hochberg multiple testing correction
- Identify significantly enriched pathways (FDR < 0.05)
Functional Validation in Models
- Design CRISPR guides for top candidate genes
- Transfert neuronal cell lines (e.g., SH-SY5Y) or iPSC-derived neurons
- Assess phenotypic changes in neurite outgrowth, synaptic maturation
Single-cell Transcriptomic Confirmation
- Process control and edited cells for scRNA-seq
- Utilize scMGCA or similar topological analysis tools for clustering
- Identify differentially expressed pathways and disrupted networks
Data Integration and Interpretation Guidelines
Quantitative Assessment Metrics
Table 5: Key Metrics for Prioritization Confidence Scoring
| Assessment Category | Specific Metrics | Weighting Factor |
|---|---|---|
| Topological Significance | Betweenness centrality percentile, Degree centrality | 30% |
| Functional Genomic Evidence | Brain expression level, Developmental timing specificity | 25% |
| Genetic Evidence | Rare variant burden, De novo mutation frequency | 25% |
| Pathway Relevance | Enrichment FDR, Biological plausibility | 20% |
Subtype-Specific Interpretation Framework
When applying this protocol within the context of autism subtype specificity:
- For Social/Behavioral Challenges subtype: Prioritize genes with postnatal expression patterns and connections to neurotransmitter signaling pathways
- For Mixed ASD with Developmental Delay subtype: Focus on prenatal neurodevelopmental genes and rare inherited variants
- For Broadly Affected subtype: Emphasize genes with high de novo mutation rates and fundamental cellular processes
This integrated protocol enables the transition from topological predictions to biologically validated mechanisms, offering a robust framework for gene prioritization in complex neurodevelopmental disorders. The combination of computational network analysis with functional genomic validation creates a powerful strategy for elucidating the complex genetic architecture of autism spectrum disorder.
Current genome-wide studies for Autism Spectrum Disorder (ASD) generate vast lists of candidate genes from copy number variants (CNVs) and sequencing data, creating a critical bottleneck in identifying true pathogenic factors [2] [35]. Network-based prioritization approaches, particularly those leveraging betweenness centrality in protein-protein interaction (PPI) networks, have emerged as powerful computational strategies to manage this complexity. Betweenness centrality identifies nodes that act as bridges in a network, potentially pinpointing proteins that coordinate biological processes [2]. However, these topological measures inherently favor highly connected hubs, which may represent essential cellular components without specific relevance to neurodevelopmental processes [13]. This application note presents a refined systems biology protocol that integrates multiple biological filters to ensure prioritized genes demonstrate both network importance and contextual biological relevance to ASD pathophysiology, moving beyond mere connectivity to deliver more meaningful candidate genes for experimental validation.
Quantitative Foundation: Key Metrics in Network-Based Gene Prioritization
Table 1: Core Topological and Expression Metrics for Prioritized ASD Candidate Genes [2]
| Gene Symbol | SFARI Score | Syndromic | Betweenness Centrality | Relative Betweenness Centrality (%) | Brain Expression (TPM) | Brain Expression Level |
|---|---|---|---|---|---|---|
| ESR1 | - | - | 0.0441 | 100 | 1.334 | Low |
| LRRK2 | - | - | 0.0349 | 79.14 | 4.878 | Low |
| APP | - | - | 0.0240 | 54.42 | 561.1 | High |
| JUN | - | - | 0.0200 | 45.35 | 97.62 | High |
| CFTR | - | - | 0.0189 | 42.86 | 0.9818 | Low |
| HTT | - | - | 0.0179 | 40.59 | 37.64 | Medium |
| DISC1 | 2 | 0 | 0.0169 | 38.32 | 2.495 | Low |
| MYC | - | - | 0.0161 | 36.51 | 3.305 | Low |
| CUL3 | 1 | 0 | 0.0150 | 34.01 | 22.88 | Medium |
| YWHAG | 3 | 1 | 0.0097 | 22.00 | 554.5 | High |
| MAPT | 3 | 0 | 0.0096 | 21.77 | 223.0 | High |
| MEOX2 | - | - | 0.0087 | 19.73 | 0.6813 | Low |
Table 2: Statistical Enrichment of SFARI Genes in Network A vs. Random Expectation [2] [13]
| SFARI Gene Category | Enrichment in Network A | Random Expectation (Mean ± SD) | P-value |
|---|---|---|---|
| Score 1 (High Confidence) | 96.5% | 46.6% ± 2.1% | < 2.2 × 10⁻¹⁶ |
| Score 2 (Strong Candidate) | 98.9% | 56.2% ± 1.6% | < 2.2 × 10⁻¹⁶ |
| Score 3 (Suggestive Evidence) | 82.8% | 36.7% ± 2.4% | < 2.2 × 10⁻¹⁶ |
Integrated Experimental Protocol for Biologically Relevant Gene Prioritization
Stage 1: Construction of a Contextually Filtered Protein-Protein Interaction Network
Purpose: To build a comprehensive yet biologically relevant PPI network specifically contextualized for ASD research.
Materials:
- SFARI Gene database (containing 768 non-syndromic genes with scores 1 and 2) [2]
- IMEx database for experimentally validated physical protein interactions [2]
- Human Protein Atlas (HBTB RNA-seq data from 966 brain tissue samples) [13]
- Computational resources for network construction (e.g., Cytoscape, custom Python/R scripts)
Procedure:
- Seed Gene Collection: Query SFARI database to obtain all non-syndromic genes with confidence scores 1 (high confidence) and 2 (strong candidate). This yields 768 initial seed genes [2].
- Primary Network Expansion:
- Retrieve first-order interactors of SFARI seed genes from IMEx database
- Construct initial PPI network (Network A) containing 12,598 nodes and 286,266 edges
- Validate significant SFARI gene enrichment versus random expectation using Monte Carlo simulation with 1,000 random gene sets from HGNC database [2] [13]
- Brain Expression Filtering:
- Cross-reference all network nodes with Human Protein Atlas brain expression data
- Filter to retain only genes expressed in brain tissue (TPM > 1 recommended)
- This reduces network to 11,879 nodes (94.3% of original) while maintaining biological relevance [13]
- Network Validation: Confirm that filtered network maintains significant enrichment for SFARI genes across all confidence categories (p < 2.2 × 10⁻¹⁶) [13].
Stage 2: Multi-Dimensional Gene Prioritization with Biological Context
Purpose: To identify high-priority candidate genes using betweenness centrality while accounting for ASD-specific biological context.
Materials:
- Contextually filtered PPI network from Stage 1
- Betweenness centrality calculation algorithms (e.g., NetworkX, igraph)
- Gene expression data from developing and adult human brain
- CNV data from ASD cohorts (e.g., array-CGH data from 135 patients) [2] [35]
Procedure:
- Topological Analysis:
- Calculate betweenness centrality for all nodes in the filtered network
- Generate ranked list of genes based on betweenness centrality scores
- Extract top 30 candidates based on centrality metrics [2]
- Biological Context Integration:
- Annotate prioritized genes with spatiotemporal brain expression patterns
- Cross-reference with genes in CNVs of unknown significance from ASD patients
- Filter candidates based on expression during critical neurodevelopmental windows
- Functional Validation:
Stage 3: Experimental Validation Framework for Prioritized Candidates
Purpose: To establish functional relevance of prioritized genes through targeted experimental approaches.
Materials:
- Cell culture models (e.g., neuronal progenitor cells, induced pluripotent stem cells)
- Gene editing tools (e.g., CRISPR-Cas9 for knock-down/knock-out studies)
- Behavioral model systems (e.g., zebrafish embryos for craniofacial and neural development assays) [67]
Procedure:
- In Vitro Functional Assessment:
- Implement knock-down of candidate genes (e.g., CDC5L, RYBP, MEOX2) in neuronal models
- Assess impacts on neuronal differentiation, migration, and synapse formation
- Evaluate protein expression and localization changes
- In Vivo Validation:
- Utilize zebrafish embryo model for rapid functional screening
- Perform morpholino-mediated knock-down of candidate gene homologs
- Quantify craniofacial defects and neural development phenotypes [67]
- Multi-Omics Integration:
- Analyze co-expression patterns with established ASD genes
- Assess presence of de novo mutations in ASD sequencing datasets
- Validate protein function in relevant biological pathways
Visualization: Integrated Workflow for Biologically Relevant Gene Prioritization
Figure 1: Integrated workflow for biologically contextualized gene prioritization in ASD research. The diagram illustrates the sequential process from data integration through network construction, multi-dimensional prioritization, and experimental validation, emphasizing the critical filtering steps that ensure biological relevance beyond mere connectivity.
The Scientist's Toolkit: Essential Research Reagent Solutions
Table 3: Key Research Reagents and Resources for ASD Gene Prioritization Studies
| Resource Category | Specific Tool/Database | Primary Function in Protocol | Key Features/Benefits |
|---|---|---|---|
| Gene Databases | SFARI Gene | Provides curated ASD-associated seed genes for network initiation | Categorizes genes by confidence levels (1-3); distinguishes syndromic vs. non-syndromic genes [2] |
| Interaction Repositories | IMEx Database | Sources experimentally validated protein-protein interactions | Consortium of major public data providers; physical interactions with experimental evidence [2] |
| Expression Resources | Human Protein Atlas (HBTB) | Filters networks based on brain-specific expression | RNA-seq data from 966 brain tissue samples; enables tissue-contextual filtering [13] |
| Computational Tools | Betweenness Centrality Algorithms | Identifies bottleneck genes in PPI networks | NetworkX, igraph implementations; highlights coordination points rather than just hubs [2] |
| Validation Systems | Zebrafish Embryo Model | Rapid in vivo functional screening of candidate genes | Permits morpholino-mediated knock-down; craniofacial and neural development assays [67] |
| Pathway Analysis | Over-representation Analysis (ORA) | Identifies enriched biological pathways | Fisher's exact test with multiple testing correction; reveals mechanistic insights [2] |
Critical Pathway Visualization: Signaling Mechanisms in ASD Pathogenesis
Figure 2: Key signaling pathways and biological processes identified through biologically contextualized gene prioritization. The diagram illustrates how genes with high betweenness centrality (network bottlenecks) map to specific ASD-relevant pathways, particularly highlighting ubiquitin-mediated proteolysis and cannabinoid receptor signaling as potentially perturbed mechanisms in ASD pathogenesis.
The integrated protocol presented herein addresses a fundamental challenge in network medicine approaches to complex neurodevelopmental disorders. By moving beyond topological measures alone and incorporating critical biological filters—particularly brain-specific expression patterns and functional pathway context—researchers can significantly enhance the biological relevance of gene prioritization outcomes. This methodology transforms betweenness centrality from a pure connectivity metric into a powerful tool for identifying regulator genes that occupy critical positions in ASD-relevant biological networks. The resulting prioritized gene lists show enhanced functional coherence and greater potential for successful experimental validation, ultimately accelerating the discovery of bona fide ASD risk genes and revealing novel therapeutic targets for this complex neurodevelopmental condition.
The quest to identify causative genes in complex neurodevelopmental disorders like Autism Spectrum Disorder (ASD) requires sophisticated computational approaches that can navigate the intricate landscape of polygenic inheritance and biological networks. Traditional genome-wide association studies (GWAS) often face challenges in defining a clear genotype-to-phenotype model for conditions with significant etiological heterogeneity [68]. Among advanced techniques, game theoretic centrality has emerged as a powerful framework for prioritizing influential disease-associated genes within biological networks by evaluating their synergistic influence [68]. Concurrently, machine learning integration is transforming gene prioritization by leveraging pattern recognition in large-scale genomic datasets. When framed within the specific context of betweenness centrality gene prioritization for autism research, these methodologies offer promising avenues for decoding the polygenic associations underlying ASD's complex architecture, potentially leading to improved diagnostic yields and novel therapeutic targets [68] [69] [41].
Theoretical Foundations and Key Concepts
Game Theoretic Centrality in Biological Networks
Game theoretic centrality extends coalitional game theory (CGT) to incorporate a priori knowledge from biological networks through a Shapley value-based measure, ranking genes by their synergistic influence in gene-to-gene interaction networks [68]. This approach evaluates a gene's contribution to the overall connectivity of its corresponding node in a biological network, considering the combinatorial effect of groups of variants working in concert to produce a phenotype [68]. Unlike traditional centrality measures that focus solely on topological properties, game theoretic centrality captures the marginal contribution of each gene across all possible coalitions, thereby identifying genes with disproportionate influence on network structure and function.
Betweenness Centrality in Gene Prioritization
Betweenness centrality quantifies the extent to which a node lies on the shortest paths between other nodes in a network, identifying crucial bridging entities that facilitate connectivity [70]. In gene networks, proteins with high betweenness often serve as critical intermediaries in signaling pathways or regulatory cascades. Mathematically, the betweenness centrality of node n is expressed as:
[Betw(n) = \sum{i \neq n \neq j \in N} \frac{\sigma{i,j}(n)}{\sigma_{i,j}}]
where (\sigma{i,j}) is the total number of shortest paths between nodes i and j, and (\sigma{i,j}(n)) is the number of those paths passing through node n [70]. In ASD research, betweenness centrality helps identify genes that occupy strategically important positions in protein-protein interaction networks, potentially serving as hubs in pathogenic processes.
Machine Learning Integration Strategies
Machine learning approaches enhance gene prioritization through several paradigms: (1) Network propagation methods that simulate random walks to identify functionally important nodes; (2) Deep learning architectures like DeepGenePrior that utilize variational autoencoders to prioritize candidate genes without relying solely on guilt-by-association principles; and (3) Feature augmentation techniques that incorporate network controllability metrics and centrality measures to enrich node representations in graph neural networks [71] [72] [73]. These methods address limitations of traditional statistical approaches by capturing complex, non-linear relationships in high-dimensional genomic data.
Quantitative Comparison of Gene Prioritization Techniques
Table 1: Performance Comparison of Gene Prioritization Methods in Autism Research
| Method Category | Specific Approach | Key Features | Reported Performance/Outcomes |
|---|---|---|---|
| Game Theoretic Methods | Game Theoretic Centrality (Shapley value) | Incorporates combinatorial effects of variants; integrates prior biological knowledge | Top-ranked genes enriched for ASD pathways; identified HLA genes (HLA-A, HLA-B, HLA-G, HLA-DRB1) [68] |
| Network Centrality | Betweenness Centrality | Identifies bridge nodes in shortest paths; global network perspective | ~10-20% overlap with game theoretic centrality results; different prioritization pattern [68] |
| Machine Learning | DeepGenePrior (VAE) | Uses CNV data without prior association knowledge; deep learning architecture | 12% increase in fold enrichment for brain-expressed genes; 15% increase for nervous system phenotype genes [73] |
| Integrative Scoring | AutScore/AutScore.r | Combines pathogenicity, clinical relevance, gene-disease association | 85% detection accuracy; 10.3% diagnostic yield in ASD cohort [41] |
| Network Diffusion | ND + Closeness Centrality | Combines network propagation with centrality measures | Improved precision in disease-gene identification across 40 diseases [72] |
Table 2: Centrality Measures for Network-Based Gene Prioritization
| Centrality Measure | Conceptual Basis | Advantages | Limitations in Gene Prioritization |
|---|---|---|---|
| Betweenness Centrality | Number of shortest paths passing through a node | Identifies bridge/bottleneck nodes; critical for information flow | Computationally intensive (O(n²)); requires global network knowledge [70] |
| Game Theoretic Centrality | Marginal contribution to all possible coalitions (Shapley value) | Captures synergistic effects; integrates biological knowledge | Complex computation; requires well-annotated networks [68] |
| Degree Centrality | Number of direct connections to a node | Simple, intuitive; identifies hubs | Misses functionally important nodes with few but critical connections [39] |
| Closeness Centrality | Average distance to all other nodes | Identifies nodes that efficiently reach entire network | Less effective in disconnected networks; global measure [72] |
| Eigenvector Centrality | Connections to well-connected nodes | Identifies influential nodes in network | May reinforce already known hubs; limited novel discovery [39] |
Application Notes and Experimental Protocols
Protocol 1: Game Theoretic Centrality Analysis for ASD Gene Discovery
Objective: Implement game theoretic centrality to identify and prioritize candidate genes in ASD using whole genome sequence data from multiplex families.
Materials and Reagents:
- Biological Samples: Whole genome sequence data from 756 multiplex autism families (1,965 children) [68]
- Protein-Protein Interaction Network: STRING database for well-annotated genes with protein products [68]
- Analysis Framework: Coalitional game theory implementation with Shapley value calculation
- Validation Resources: Simon's Foundation Autism Research Initiative (SFARI) gene database, Root 66 gene list, known ASD-associated rare variants [68]
Methodology:
- Data Preprocessing:
- Filter likely gene disrupting (LGD) variants from whole genome sequence data
- Map variants to genes and construct gene-variant association matrix
- Annotate genes using STRING database protein-protein interaction network
Game Theoretic Centrality Calculation:
- Define genes as "players" in coalitional game theory framework
- Calculate Shapley value for each gene: (\phii(v) = \sum{S \subseteq N \setminus {i}} \frac{|S|! (|N| - |S| - 1)!}{|N|!} (v(S \cup {i}) - v(S)))
- where (v(S)) represents the value (network connectivity impact) of coalition S
- Implement both weighted and unweighted approaches for robustness
Gene Ranking and Prioritization:
- Rank genes based on descending Shapley values
- Apply threshold (e.g., top 5%) to select high-priority candidates
- Compare results with CASh analysis genes to assess impact of network information
Biological Validation:
- Conduct pathway enrichment analysis on top-ranking genes
- Cross-reference with established ASD gene databases (SFARI)
- Validate immune pathway enrichment (e.g., HLA genes HLA-A, HLA-B, HLA-G, HLA-DRB1)
Technical Notes: The protein-protein interaction network primarily includes well-annotated genes with protein products, potentially excluding pseudogenes. Isolated genes in the network should be removed for comparable analysis with other centrality measures [68].
Protocol 2: Betweenness Centrality-Guided Network Analysis for ASD Modules
Objective: Identify critical bottleneck genes in ASD-associated biological networks using betweenness centrality measures.
Materials and Reagents:
- Network Data: Protein-protein interaction network from STRING or similar database
- Seed Genes: Known ASD-associated genes from SFARI database
- Computational Tools: Network analysis software (e.g., Cytoscape with betweenness centrality plugins)
- Validation Dataset: Whole-exome sequencing data from 581 ASD probands [41]
Methodology:
- Network Construction:
- Compile comprehensive protein-protein interaction network
- Integrate known ASD-associated genes as seed nodes
- Annotate network nodes with gene expression data from developing brain
Betweenness Centrality Computation:
- Calculate betweenness centrality for all nodes: (Betw(n) = \sum{i \neq n \neq j \in N} \frac{\sigma{i,j}(n)}{\sigma_{i,j}})
- Implement optimized algorithm for large biological networks
- Consider ego betweenness approximation for reduced computational complexity: (EgoBetw(n) = \sum{i \neq n \neq j \in N'} \frac{\sigma{i,j}(n)}{\sigma_{i,j}}) where N' represents ego network [70]
Module Identification:
- Extract high-betweenness nodes as potential network bottlenecks
- Apply community detection algorithms to identify functionally coherent modules
- Analyze module enrichment for specific biological pathways
Integration with Genetic Evidence:
- Overlap high-betweenness genes with rare variants from ASD WES data
- Prioritize genes with both structural importance and mutational burden
- Validate using clinical geneticist assessment based on ACMG guidelines
Technical Notes: Betweenness centrality calculation has messaging overhead of O(n²) and memory overhead of O(n²), making it computationally intensive for large networks. Consider ego betweenness approximation (O(n) messaging overhead, O(d²) memory overhead) for resource-constrained environments [70].
Protocol 3: Machine Learning Integration with Centrality Features for ASD Gene Prioritization
Objective: Develop a hybrid machine learning model that integrates centrality measures with genomic features for improved ASD gene prioritization.
Materials and Reagents:
- Training Data: CNV data from 74,811 individuals (cases and controls for autism, schizophrenia, developmental delay) [73]
- Feature Set: Centrality measures (betweenness, closeness, eigenvector), network controllability metrics, genomic annotations
- Computational Framework: Deep learning environment (TensorFlow/PyTorch), graph neural network implementation
- Validation Benchmark: Biological benchmarks including brain expression and mouse nervous system phenotypes
Methodology:
- Feature Engineering:
- Calculate multiple centrality measures for genes in protein-protein interaction network
- Compute network control theory metrics (average controllability)
- Extract CNV features from case-control datasets
- Generate augmented feature vectors combining structural and genomic information
Model Architecture:
- Implement DeepGenePrior variational autoencoder (VAE) framework
- Alternatively, design graph neural network with message passing mechanism
- Incorporate centrality features through feature augmentation pipeline (NCT-EFA) [71]
- Train with reconstruction and classification objectives
Model Training and Optimization:
- Pre-train on large CNV dataset across multiple brain disorders
- Fine-tune on ASD-specific data
- Apply regularization techniques to prevent overfitting
- Optimize hyperparameters using cross-validation
Validation and Interpretation:
- Evaluate fold enrichment for brain-expressed genes
- Assess enrichment for mouse nervous system phenotypes
- Identify top candidate genes common across multiple disorders (e.g., ZDHHC8, DGCR5)
- Perform pathway analysis on prioritized gene sets
Technical Notes: When node features are unavailable or sparse, use one-hot encoding of node degrees as baseline, then augment with centrality and controllability metrics. This approach has shown up to 11% performance improvement in GNN models [71].
Visualization of Workflows and Relationships
Game Theoretic Centrality Workflow for ASD Gene Discovery
Game Theoretic Centrality Analysis Workflow for ASD Gene Discovery
Integration of Centrality Measures in Machine Learning Pipeline
Integration of Centrality Measures in Machine Learning Pipeline
The Scientist's Toolkit: Research Reagent Solutions
Table 3: Essential Research Reagents and Resources for ASD Gene Prioritization Studies
| Resource Category | Specific Resource | Function/Application | Key Features |
|---|---|---|---|
| Genomic Databases | SFARI Gene Database [68] [41] | Curated ASD-associated genes | Evidence scores for ASD association; regularly updated |
| Protein Networks | STRING Database [68] | Protein-protein interaction network | Comprehensive coverage; functional associations |
| Variant Annotation | InterVar [41] | Pathogenicity classification | ACMG/AMP guideline implementation; automated |
| Phenotype Data | Human Phenotype Ontology (HPO) [34] | Standardized phenotype terms | Enables computational phenotype analysis |
| Prioritization Tools | AutScore/AutScore.r [41] | Integrative variant scoring | Combines multiple evidence sources; ASD-specific |
| Machine Learning | DeepGenePrior [73] | Deep learning prioritization | VAE architecture; CNV data utilization |
| Network Analysis | DIAMOnD Algorithm [72] | Disease module detection | Connectivity pattern analysis |
| Validation Resources | DECIPHER Database [73] | CNV and phenotype data | Large-scale cohort data; multiple disorders |
Benchmarking Performance: How Betweenness Centrality Stacks Up Against Other Methods
The genetic architecture of Autism Spectrum Disorder (ASD) is notably complex and heterogeneous, involving hundreds of susceptibility genes. The Simons Foundation Autism Research Initiative (SFARI) Gene database serves as a crucial resource, providing expertly curated genes classified by the strength of evidence linking them to ASD [19] [74]. In this context, computational approaches, particularly those leveraging betweenness centrality in biological networks, have emerged as powerful tools for prioritizing novel candidate genes from large-scale genomic datasets [35] [2].
However, the development of robust gene prioritization models is contingent upon rigorous validation frameworks. This application note addresses the critical need for cross-validation frameworks specifically designed to assess the performance of prediction models on independent SFARI genes. We detail protocols for applying systems biology approaches that integrate protein-protein interaction (PPI) networks with topological analysis, ensuring that predictive models generalize effectively beyond their training data, thereby enhancing the discovery of novel ASD-associated genes.
Methodological Framework
Core Principles of Betweenness Centrality Gene Prioritization
The foundational principle of this approach is that genes causing similar disorders often reside in close proximity within biological networks. Betweenness centrality is a topological measure that identifies nodes that act as bridges between different parts of a network. In PPI networks, proteins with high betweenness centrality often play critical roles in coordinating biological processes and may represent key points of vulnerability in genetic disorders like ASD [35] [2].
The underlying hypothesis is that novel ASD candidate genes can be identified by their strategic positions in a PPI network constructed from known SFARI genes. These candidates are expected to have high betweenness centrality scores, indicating their potential importance in the network topology associated with ASD pathophysiology. Validation of these predictions requires careful cross-validation to ensure biological relevance rather than topological artifact [2] [13].
Workflow for Network-Based Gene Prioritization and Validation
The following diagram illustrates the integrated workflow for gene prioritization and cross-validation, combining PPI network analysis with rigorous validation protocols.
Experimental Protocols
Protocol 1: Construction of ASD-Focused PPI Network
Objectives and Applications
This protocol details the construction of a protein-protein interaction network centered on known ASD genes, providing the foundation for topological analysis and gene prioritization. The resulting network serves as a scaffold for identifying novel candidates based on their connectivity patterns and central positioning relative to established SFARI genes.
Materials and Reagents
- SFARI Gene Database (current version): Source of seed genes with SFARI scores 1 and 2 (high and strong confidence) [19] [75].
- IMEx Database: Curated repository of protein-protein interactions with experimental validation [2].
- Bioinformatics Software: Network analysis tools (e.g., Cytoscape, NetworkX) and statistical computing environment (R/Python).
Step-by-Step Procedure
- Query SFARI Gene database to retrieve all non-syndromic genes with Score 1 (high confidence) and Score 2 (strong candidate).
- Extend the gene list by retrieving first-degree interactors using the IMEx database to include experimentally validated physical interactions.
- Construct the PPI network with proteins as nodes and physical interactions as edges.
- Filter for brain expression using data from the Human Protein Atlas (HBTB samples) to increase biological relevance to ASD.
- Validate network specificity using a Monte Carlo approach by comparing SFARI gene enrichment against 1000 randomly generated gene sets of equal size [2] [13].
Protocol 2: Topological Analysis and Gene Prioritization
Objectives and Applications
This protocol describes the calculation of network topology metrics, with emphasis on betweenness centrality, to identify genes occupying strategically important positions that may represent novel ASD candidates worthy of experimental validation.
Materials and Reagents
- PPI Network from Protocol 1.
- Network Analysis Software: Cytoscape with NetworkAnalyzer plugin, or custom scripts in R/Python using igraph/NetworkX libraries.
- Centrality Calculation Algorithms: Implementations of betweenness, closeness, and degree centrality metrics.
Step-by-Step Procedure
- Calculate topological metrics for each node in the network, with particular emphasis on betweenness centrality.
- Generate ranked gene list by sorting genes in descending order of betweenness centrality values.
- Identify top candidates from the prioritized list for further validation, focusing on genes not currently in SFARI or with weak evidence (Score 3) [2].
- Validate metric correlation by examining relationships between different centrality measures to ensure consistent ranking.
Table 1: Topological Analysis of SFARI-Based PPI Network
| Gene | SFARI Score | Betweenness Centrality | Relative Betweenness (%) | Expression in Brain |
|---|---|---|---|---|
| ESR1 | Not assigned | 0.0441 | 100 | Low |
| LRRK2 | Not assigned | 0.0349 | 79.14 | Low |
| APP | Not assigned | 0.0240 | 54.42 | High |
| JUN | Not assigned | 0.0200 | 45.35 | High |
| CUL3 | 1 | 0.0150 | 34.01 | Medium |
| YWHAG | 3 | 0.0097 | 22.00 | High |
| MAPT | 3 | 0.0096 | 21.77 | High |
| MEOX2 | Not assigned | 0.0087 | 19.73 | Low |
| HRAS | 1 | 0.0072 | 16.33 | Medium |
Protocol 3: Cross-Validation Framework for Prediction Models
Objectives and Applications
This protocol provides a structured approach for validating gene prioritization models using independent SFARI gene sets and phenotypic data, ensuring that predictions generalize beyond training data and have biological relevance to ASD pathophysiology.
Materials and Reagents
- Simons Searchlight Dataset: Phenotypic and genetic data from over 5,600 individuals with genetic diagnoses [76].
- Human Phenotype Ontology (HPO): Standardized vocabulary for phenotypic abnormalities.
- Validation Cohorts: Independent ASD patient cohorts with array-CGH or whole-exome sequencing data.
Step-by-Step Procedure
- Partition SFARI genes into training and validation sets based on evidence scores, using higher-confidence genes (Scores 1-2) for training and lower-confidence genes (Score 3) for validation.
- Apply phenotype-based validation using HPO terms to assess whether predicted genes show phenotypic overlap with known ASD genes [34].
- Implement clustering-based cross-validation (CCV) by grouping experimentally similar conditions together to create more distinct training-test partitions [77].
- Calculate distinctness scores for test sets to quantify their dissimilarity from training conditions, providing a more realistic assessment of generalizability [77].
- Validate predictions experimentally using array-CGH data from ASD patients, focusing on genes within copy number variants of unknown significance [2].
Table 2: Cross-Validation Approaches for Gene Prioritization Models
| Method | Key Features | Advantages | Limitations |
|---|---|---|---|
| Random CV (RCV) | Random partitioning of samples into training/test sets | Standard approach, simple implementation | May produce over-optimistic estimates if test/training sets are similar |
| Clustering-based CV (CCV) | Groups similar experimental conditions into same fold | Provides more realistic estimate for dissimilar conditions | Dependent on clustering algorithm and parameters |
| Phenotype-informed Validation | Uses HPO terms to assess phenotypic similarity | Direct biological relevance to clinical manifestations | Requires comprehensive phenotypic data |
| Simulated Annealing CV (SACV) | Systematically generates partitions with varying distinctness | Allows performance evaluation across distinctness spectrum | Computationally intensive to implement |
The Scientist's Toolkit
Table 3: Essential Research Reagents and Resources
| Resource | Type | Function in Analysis | Source/Availability |
|---|---|---|---|
| SFARI Gene Database | Curated database | Provides expert-curated ASD gene sets with evidence scores | SFARI Gene [19] [75] |
| IMEx Database | Protein interaction repository | Source of experimentally validated PPIs for network construction | IMEx Consortium [2] |
| Simons Searchlight | Phenotypic dataset | Provides genetic and phenotypic data for validation | Available to approved researchers [76] |
| Human Phenotype Ontology (HPO) | Standardized vocabulary | Enables phenotype-based validation of candidate genes | HPO Database [34] |
| Human Protein Atlas | Expression database | Filters for brain-expressed genes to increase relevance | Protein Atlas [2] |
Validation and Results Interpretation
Analytical Validation Framework
Effective validation of ASD gene predictions requires multiple complementary approaches. Betweenness centrality ranking must be coupled with pathway enrichment analysis to identify biological processes potentially perturbed in ASD. The over-representation analysis (ORA) using Fisher's exact test with Benjamini-Hochberg correction can reveal significantly enriched pathways such as ubiquitin-mediated proteolysis and cannabinoid receptor signaling, providing biological plausibility for prioritized genes [2].
Additionally, phenotype-based validation strengthens the evidence for candidate genes. Studies demonstrate that known ASD genes from SFARI and HPO databases show significantly higher phenotype counts (16.1±5.7) compared to non-ASD genes (6.5±5.4), supporting the use of phenotypic burden as a validation metric [34]. This approach successfully ranked 16 of 20 expert-identified causal variants as top candidates, outperforming conventional tools like VARELECT.
Critical Evaluation of Limitations
Several limitations must be considered when implementing these validation frameworks. Betweenness centrality tends to highlight highly connected hubs in PPI networks, which may not necessarily be specific to ASD pathophysiology [13]. The size and specificity of the initial PPI network significantly impacts results, with overly large networks (e.g., >12,000 nodes) potentially reducing specificity for ASD-relevant genes [13].
Furthermore, SFARI genes themselves show elevated expression levels compared to other neuronal genes, creating a potential confounder that must be addressed through appropriate normalization methods [74]. Recent research proposes novel approaches to correct for this continuous source of bias, which should be incorporated into validation pipelines.
Visualizing the Cross-Validation Strategy
The following diagram illustrates the cross-validation workflow that ensures robust assessment of gene prioritization models, specifically designed to address the challenges of ASD genomic data.
In the field of computational genomics, particularly for gene prioritization in complex disorders like autism spectrum disorder (ASD), robust model assessment is critical. Area Under the Receiver Operating Characteristic curve (AUROC) and Area Under the Precision-Recall Curve (AUPRC) are two fundamental metrics for evaluating binary classification performance. AUROC measures the model's ability to distinguish between positive and negative classes across all classification thresholds, plotting True Positive Rate against False Positive Rate. AUPRC focuses on the model's performance on the positive class, plotting precision against recall, providing a more informative picture under class imbalance, a common scenario in genomics where true disease-associated genes are far outnumbered by non-associated genes. For ASD gene prioritization using betweenness centrality, these metrics validate whether network position effectively identifies true causal genes.
Table 1: Key Characteristics of AUROC and AUPRC
| Metric | Full Name | Interpretation | Optimal Value | Best Suited For |
|---|---|---|---|---|
| AUROC | Area Under the Receiver Operating Characteristic Curve | Probability that a random positive is ranked higher than a random negative | 1.0 | Balanced datasets; overall performance assessment |
| AUPRC | Area Under the Precision-Recall Curve | Weighted average of precision achieved at each threshold | 1.0 | Imbalanced datasets; focus on positive class performance |
Quantitative Performance of Network-Based Gene Prioritization
Network-based gene prioritization methods that leverage network centrality have demonstrated strong performance in identifying ASD-associated genes. A 2024 study integrating multiple omic datasets with network propagation reported an AUROC of 0.87 and an AUPRC of 0.89 in cross-validation for predicting ASD causal genes [78]. This model, which used a random forest classifier on features derived from network propagation scores, outperformed the previous state-of-the-art method, forecASD, which achieved an AUROC of 0.82 in the same benchmark [78]. The high performance underscores the value of combining network topology with multi-omic data.
Another study focusing on network diffusion combined with centrality measures for disease-gene identification found that integrating closeness centrality significantly improved prioritization precision across 40 different diseases [72]. While this study did not report specific AUROC/AUPRC values for ASD, the demonstrated effectiveness of centrality-integrated methods across multiple diseases suggests similar potential for ASD applications. Benchmarking studies have shown that network propagation methods generally achieve strong performance, with one large-scale benchmark reporting that top-performing methods can identify true positive genes within the top 1-10% of ranked candidate lists [79].
Table 2: Reported Performance of Gene Prioritization Methods in Autism Research
| Method / Study | Core Approach | Reported AUROC | Reported AUPRC | Key Findings |
|---|---|---|---|---|
| Multi-omic Network Propagation [78] | Integration of genomic, transcriptomic, and proteomic data with network propagation | 0.87 | 0.89 | Outperformed previous state-of-the-art methods |
| forecASD (Benchmark) [78] | Integration of network, genetic association, and brain expression data | 0.82 | Not Reported | Used as a baseline for comparison in recent studies |
| Network Diffusion with Centrality [72] | Extension of network diffusion using centrality measures (e.g., closeness) | Significant improvement over baseline (values NS) | Not Reported | Improved precision in identifying disease-related genes |
Experimental Protocol for Validating Gene Prioritization Models
Benchmarking Workflow for Gene Prioritization
This protocol outlines a robust framework for benchmarking gene prioritization methods, such as those using betweenness centrality, using AUROC and AUPRC, adapted from established benchmarking suites [79].
Step 1: Preparation of Benchmark Data
- Positive Controls: Obtain high-confidence gene sets. For ASD, use SFARI Gene Database (https://gene.sfari.org/) 'Category 1' genes (high confidence) as positive examples [78]. Expect approximately 200 genes.
- Negative Controls: Select genes not associated with ASD. Randomly sample an equal number of genes not listed in SFARI to create a balanced set [78]. For imbalance scenarios, increase negative control count.
- Protein-Protein Interaction (PPI) Network: Download a comprehensive human PPI network, such as from the STRING database (https://string-db.org/) or the dataset from Signorini et al. (2021) containing ~20,933 proteins and ~251,078 interactions [78].
Step 2: Calculation of Betweenness Centrality Features
- Network Preprocessing: Load the PPI network into a graph analysis environment (e.g., Python's NetworkX library or R's igraph). Ensure the network is represented as an undirected graph.
- Centrality Computation: Calculate betweenness centrality for all nodes (genes) in the network. Betweenness centrality for a node ( v ) is calculated as: ( BC(v) = \sum{s \neq v \neq t} \frac{\sigma{st}(v)}{\sigma{st}} ) where ( \sigma{st} ) is the total number of shortest paths from node ( s ) to node ( t ), and ( \sigma_{st}(v) ) is the number of those paths passing through ( v ).
- Feature Integration: Use raw betweenness centrality scores or integrate them into a larger feature set, potentially combining them with other network features or omic data.
Step 3: Model Training and Cross-Validation
- Classifier Selection: Implement a classifier such as a Random Forest, as it performs well with genomic data [78]. Use default parameters (100 trees, no max depth) or optimize via hyperparameter tuning.
- Stratified K-Fold Cross-Validation: Split the data into k folds (e.g., k=5), preserving the percentage of positive samples in each fold. This ensures reliable performance estimation.
- Model Training: Iteratively train the model on k-1 folds, using the remaining fold for testing. Repeat until each fold serves as the test set once.
Step 4: Calculation of AUROC and AUPRC
- Score Generation: For each test fold, obtain the model's prediction scores (probabilities) for all genes.
- Metric Calculation:
- AUROC: Calculate the True Positive Rate (TPR) and False Positive Rate (FPR) across a range of score thresholds. Plot TPR vs. FPR and compute the area under the curve.
- AUPRC: Calculate Precision and Recall across the same thresholds. Plot Precision vs. Recall and compute the area under this curve.
- Aggregation: Average the AUROC and AUPRC values across all k folds to produce a final performance estimate. Report the mean and standard deviation.
The Scientist's Toolkit: Research Reagent Solutions
Table 3: Essential Resources for Gene Prioritization and Validation
| Resource Name | Type | Primary Function in Workflow | Reference/Access |
|---|---|---|---|
| SFARI Gene Database | Curated Database | Provides authoritative, manually curated list of ASD-associated genes for benchmark positive controls. | https://gene.sfari.org/ [78] |
| STRING Database | Protein-Protein Interaction Network | Source of comprehensive human interactome data to construct the network for centrality calculation. | https://string-db.org/ [80] [72] |
| FunCoup Network | Functional Association Network | Alternative comprehensive network resource for benchmarking gene prioritization algorithms. | [79] |
| scikit-learn (sklearn) | Software Library | Provides implementation of Random Forest classifier and functions for cross-validation and metric calculation (AUROC, AUPRC). | https://scikit-learn.org/ [78] |
| NetworkX (Python) | Software Library | Facilitates graph analysis, including calculation of betweenness centrality and other network metrics. | https://networkx.org/ |
| ClinVar Database | Variant Archive | Source of known pathogenic variants used in some benchmarking approaches to create positive control sets. | https://www.ncbi.nlm.nih.gov/clinvar/ [81] |
Interpretation and Reporting Guidelines
When reporting results, clearly state the cross-validation strategy used and the mean and standard deviation of both AUROC and AUPRC across folds. An AUROC of 0.87 and AUPRC of 0.89 indicates a high-performing model for ASD gene prioritization [78]. AUPRC is often more informative than AUROC when the positive class (ASD genes) is small compared to the negative class, a typical scenario in genomics. The choice of a classification threshold can be optimized post-benchmarking; for instance, one study selected a cutoff of 0.86 to maximize the product of specificity and sensitivity [78]. Performance should also be validated on independent hold-out sets, such as SFARI Category 2 and 3 genes, to assess generalizability to lower-confidence genes [78].
The prioritization of candidate genes is a critical step in unraveling the complex etiology of autism spectrum disorder (ASD). This protocol provides a detailed comparison of two fundamental computational approaches for this task: network-based betweenness centrality and integrated machine learning models. We present standardized application notes for employing these methods, including benchmarked performance metrics, experimental workflows, and reagent solutions to facilitate their adoption in ASD research and therapeutic development.
Autism spectrum disorder is a multifactorial neurodevelopmental condition with a strong genetic component, characterized by impairments in social communication and the presence of restricted, repetitive behaviors [8] [69]. Its genetic architecture is highly heterogeneous, involving hundreds of genes that converge on biological pathways involving synaptic function, chromatin remodeling, and neurodevelopment [69] [82]. Discerning clinically relevant ASD candidate variants from extensive genomic datasets remains a complex, time-consuming process, with current diagnostic yields ranging from 3% to 30% [34] [41].
Two contrasting computational philosophies have emerged for gene prioritization. Betweenness centrality represents a classical graph-theoretic approach that identifies crucial nodes in biological networks based on their position in information flow pathways [83] [84]. In contrast, integrated machine learning models leverage multiple data dimensions and complex algorithms to predict pathogenicity, often combining network features with additional genomic and functional annotations [8] [82] [41]. This application note provides a structured framework for implementing and evaluating these complementary approaches.
Methodological Comparison & Performance Benchmarks
Conceptual Foundations and Performance Characteristics
Table 1: Core Methodological Comparison Between Betweenness Centrality and Machine Learning Approaches
| Feature | Betweenness Centrality | Machine Learning (Integrated Models) |
|---|---|---|
| Theoretical Basis | Graph theory; identifies nodes that frequently lie on shortest paths between other nodes [83] | Statistical learning; integrates diverse features to predict gene-disease associations [8] [82] |
| Primary Data Input | Protein-protein interaction networks, gene co-expression networks [8] | Multi-modal data: genomic constraints, spatiotemporal expression, network features, variant annotations [82] [41] |
| Key Assumptions | Biological importance correlates with network brokerage position; information flows along shortest paths [83] | Disease genes share detectable patterns across multiple biological dimensions [8] [82] |
| Typical Output | Centrality score for each gene/node [83] | Probability score or classification (risk gene/benign) [8] [82] |
| Strengths | Intuitive interpretation; identifies bottleneck genes; computationally efficient for single networks [83] [84] | Higher predictive accuracy; handles heterogeneous data; accommodates complex interactions [8] [41] |
| Limitations | Sensitive to network completeness; ignores functional genomic data; may miss peripherally acting genes [83] | "Black box" interpretation; requires extensive training data; computationally intensive [8] |
Quantitative Performance Benchmarks
Table 2: Empirical Performance Metrics from Published Studies
| Study & Method | Dataset | Performance Metrics | Key Findings |
|---|---|---|---|
| Hybrid GCN-LR Model [8] | 979 ASD genes from Autism Informatics Portal; 9,505 PPI interactions | Significantly improved identification of key regulator genes compared to centrality methods alone | Combined GCN feature extraction with logistic regression probability scores outperformed single-method approaches |
| AutScore.r Variant Prioritization [41] | 581 ASD probands (WES data); 1,161 rare variants | 85% detection accuracy; diagnostic yield of 10.3% | Integrated scoring of pathogenicity, clinical relevance, and gene-disease associations |
| Betweenness Centrality in Eye-Gaze Analysis [84] | 17 ASD vs. 23 TD children | Identified 4 AOIs with significant differences (vs. 1-3 for other centrality measures) | Most effective network measure for distinguishing ASD visual attention patterns |
| Machine Learning with Brain Features [82] | 121 true positive vs. 963 true negative ASD genes | Outperformed state-of-the-art scoring systems for ranking ASD candidate genes | Spatiotemporal brain expression and gene-level constraint metrics enhanced prediction |
Experimental Protocols
Protocol 1: Betweenness Centrality Analysis for ASD Gene Prioritization
Workflow Visualization
Step-by-Step Procedure
Data Acquisition and Network Construction
- Obtain a comprehensive list of ASD-associated genes from curated databases (e.g., Autism Informatics Portal, SFARI Gene) [8].
- Input these genes into the STRING database (https://string-db.org/) restricted to Homo sapiens to generate a protein-protein interaction (PPI) network.
- Export network data including all nodes (genes) and edges (interactions) for downstream analysis.
Network Preprocessing
- Remove isolated nodes (genes with no known interactions) to focus analysis on biologically relevant connections.
- Eliminate duplicate and redundant entries to ensure dataset integrity.
- Format the cleaned network as an undirected graph (G = (V, E, A)), where (V) represents nodes (genes), (E) represents edges (interactions), and (A) is the adjacency matrix [8].
Betweenness Centrality Calculation
- Compute betweenness centrality for each node using the formula: [ CB(vi) = \sum{s \neq vi \neq t} \frac{\sigma{st}(vi)}{\sigma{st}} ] where (\sigma{st}) is the number of shortest paths from node (s) to node (t), and (\sigma{st}(vi)) is the number of those paths passing through node (v_i) [8].
- Implement using network analysis libraries (e.g., Python's NetworkX, R's igraph).
Gene Ranking and Prioritization
- Rank genes in descending order based on their betweenness centrality scores.
- Select top-ranked genes (e.g., top 10%) as high-priority candidates for further investigation.
Validation
- Compare prioritized genes with known ASD genes in the SFARI database and the Evaluation of Autism Gene Link Evidence (EAGLE) framework [8].
- Perform functional enrichment analysis (e.g., GO term analysis) to identify overrepresented biological pathways.
Protocol 2: Integrated Machine Learning Approach for ASD Gene Discovery
Workflow Visualization
Step-by-Step Procedure
Multi-Modal Data Collection
- Gene Sets: Obtain labeled training genes (e.g., 121 true positive ASD genes from SFARI and 963 true negative genes from OMIM non-mental health diseases) [82].
- Network Features: Calculate multiple centrality measures (degree, betweenness, closeness, eigenvector) and clustering coefficients from PPI networks [8].
- Expression Data: Download spatiotemporal brain gene expression data from BrainSpan Atlas across 13 developmental stages and 31 brain regions [82].
- Constraint Metrics: Acquire gene-level constraint metrics from ExAC/gnomAD, including pLI scores, missense Z-scores, and LoF intolerance metrics [82].
Feature Engineering and Preprocessing
- Construct a feature matrix combining all topological, expression, and constraint features.
- Normalize all features using z-score standardization or min-max scaling.
- Handle missing data using appropriate imputation methods (e.g., k-nearest neighbors).
Model Training and Validation
- Implement a hybrid Graph Convolutional Network (GCN) with Logistic Regression (LR) final layer [8]:
- GCN layers extract features from the PPI network structure.
- LR layer outputs probability scores (0-1) for each gene.
- Alternatively, for variant prioritization, implement the AutScore.r algorithm that integrates:
- Variant pathogenicity (InterVar, ClinVar)
- Deleteriousness scores (SIFT, PolyPhen-2, CADD)
- Gene-disease associations (SFARI, DisGeNET)
- Inheritance patterns [41]
- Train models using k-fold cross-validation and optimize hyperparameters.
- Implement a hybrid Graph Convolutional Network (GCN) with Logistic Regression (LR) final layer [8]:
Gene Ranking and Prioritization
- Generate probability scores for all candidate genes.
- Rank genes in descending order based on their predicted probabilities.
- Apply predetermined thresholds (e.g., AutScore.r ≥ 0.335) to identify high-confidence candidates [41].
Biological Validation
- Evaluate infection ability of prioritized genes using susceptible-infected (SI) model to confirm their key regulatory roles [8].
- Perform differential expression analysis in ASD brain regions (e.g., prefrontal and parietal cortex) [82].
- Conduct gene ontology enrichment analysis to identify convergent biological pathways.
The Scientist's Toolkit: Research Reagent Solutions
Table 3: Essential Research Resources for ASD Gene Prioritization Studies
| Resource Category | Specific Tools/Databases | Function & Application |
|---|---|---|
| ASD Gene Databases | SFARI Gene Database [8] [82] [41] | Curated repository of ASD-associated genes with evidence categories |
| Autism Informatics Portal [8] | Comprehensive resource for ASD genetic data | |
| Network Resources | STRING Database [8] | Protein-protein interaction network construction |
| InWeb [82] | Protein interaction network for functional relationships | |
| Genomic Data | BrainSpan Atlas [82] | Spatiotemporal transcriptome data of human brain development |
| ExAC/gnomAD [82] | Gene-level constraint metrics (pLI, Z-scores) | |
| DisGeNET [41] | Gene-disease association database | |
| Variant Annotation | InterVar [41] | Clinical interpretation of sequence variants |
| CADD, REVEL, MPC [41] | In-silico prediction of variant deleteriousness | |
| ClinVar [41] | Public archive of variant interpretations | |
| Computational Tools | NetworkX (Python), igraph (R) [8] | Network analysis and centrality calculation |
| GCN implementations (PyTorch Geometric, DGL) [8] | Graph neural network modeling | |
| AutScore.r [41] | Automated ranking system for ASD candidate variants |
Discussion and Implementation Guidelines
Strategic Selection Framework
The choice between betweenness centrality and machine learning approaches should be guided by research objectives, data availability, and computational resources:
Betweenness centrality is recommended for:
- Preliminary network analysis to identify bottleneck genes
- Studies with limited genomic data but established interaction networks
- Research requiring high interpretability and straightforward biological validation
- Projects with computational constraints
Machine learning approaches are superior for:
- Maximizing prediction accuracy and diagnostic yield
- Integrating multi-modal genomic, transcriptomic, and clinical data
- Advanced research teams with bioinformatics expertise
- Clinical applications requiring highest sensitivity/specificity
Emerging Trends and Integration Opportunities
The most promising developments involve hybrid approaches that leverage the strengths of both methodologies. The GCN-LR model exemplifies this trend, using graph structures while incorporating additional features through machine learning [8]. Similarly, the AutScore.r algorithm demonstrates how multiple evidence dimensions can be systematically integrated through weighted scoring [41]. Future methodologies will likely incorporate more dynamic network representations, single-cell expression data, and epigenetic features to further enhance prediction accuracy.
Both betweenness centrality and machine learning offer valuable approaches for ASD gene prioritization, with complementary strengths and applications. Betweenness centrality provides an interpretable, network-driven method for identifying structurally important genes, while integrated machine learning models deliver higher accuracy through multi-dimensional data integration. The provided protocols and benchmarks equip researchers with standardized methodologies for implementing these approaches, facilitating more systematic and reproducible ASD gene discovery efforts. As ASD genetics continues to evolve, the strategic combination of these approaches promises to enhance both fundamental understanding and clinical translation of genetic findings in autism spectrum disorder.
Comparative Analysis with Other Centrality Measures (Degree, Eigenvector)
In the context of autism spectrum disorder (ASD) research, network biology approaches have become indispensable for prioritizing candidate genes from large-scale genomic datasets. These methods leverage protein-protein interaction (PPI) networks to identify biologically significant genes based on their topological importance. Among various network centrality measures, betweenness centrality has emerged as a particularly valuable tool for gene prioritization, offering complementary insights to other measures like degree and eigenvector centrality. While degree centrality simply counts a node's direct connections and eigenvector centrality considers the influence of a node's neighbors, betweenness centrality identifies nodes that act as critical bridges or bottlenecks in the network [85] [36]. This methodological review provides a comparative analysis of these centrality measures, with specific applications, protocols, and resources for ASD gene prioritization.
Theoretical Foundations of Centrality Measures
Definition and Mathematical Formulations
Centrality measures quantify the importance of nodes within a network from distinct perspectives, each with unique mathematical foundations and biological interpretations.
Table 1: Mathematical Definitions of Key Centrality Measures
| Centrality Measure | Mathematical Definition | Biological Interpretation | Key References |
|---|---|---|---|
| Betweenness Centrality | ( CB(v) = \sum{s \neq v \neq t} \frac{\sigma{st}(v)}{\sigma{st}} ) where ( \sigma{st} ) is the total number of shortest paths from node ( s ) to node ( t ), and ( \sigma{st}(v) ) is the number of those paths passing through node ( v ). | Identifies genes that act as bridges or bottlenecks between functional modules; potential coordinators of biological processes. | [35] [36] [86] |
| Degree Centrality | ( CD(v) = \sum{j=1}^{N} A{vj} ) where ( A{vj} ) is the adjacency matrix element (1 if connected, 0 otherwise). | Measures locally connected "hub" genes; often indicates proteins with multiple functional partners. | [85] [87] [86] |
| Eigenvector Centrality | ( xv = \frac{1}{\lambda} \sum{t \in M(v)} xt = \frac{1}{\lambda} \sum{t \in V} A{v,t} xt ) where ( M(v) ) is the set of neighbors of ( v ), and ( \lambda ) is a constant. | Identifies genes connected to other influential genes; suggests participation in central biological pathways. | [88] [86] |
| Closeness Centrality | ( CC(v) = \frac{1}{\sum{u \neq v} d{uv}} ) where ( d{uv} ) is the shortest-path distance between nodes ( u ) and ( v ). | Measures how quickly a gene can interact with all others; potential for efficient signal propagation. | [85] [86] [89] |
Comparative Strengths and Limitations in Biological Contexts
Each centrality measure offers unique advantages for biological network analysis, with betweenness centrality providing particular benefits for identifying functionally critical genes in complex disorders like ASD.
Table 2: Comparative Analysis of Centrality Measures for Gene Prioritization
| Aspect | Betweenness Centrality | Degree Centrality | Eigenvector Centrality |
|---|---|---|---|
| Computational Complexity | High (O(VE) for unweighted graphs) | Low (O(V)) | Moderate (O(V²) for power iteration) |
| Biological Insight | Identifies bridge genes connecting modules; potential pathway coordinators | Identifies locally connected hubs with multiple interactions | Identifies genes in "rich clubs"; members of central network neighborhoods |
| Sensitivity to Network Structure | High; sensitive to global network topology | Low; only local connectivity | Moderate; depends on neighbors' importance |
| Application in ASD Research | Prioritizes genes like CDC5L, RYBP, MEOX2 in PPI networks [35] | Less effective for prioritization in noisy datasets [90] | Used in PANDA framework combined with deep learning [90] |
| Key Limitation | Computationally intensive for large networks | Does not consider global network topology | Biased toward dense network regions |
Application in Autism Research: Empirical Evidence
Multiple studies have demonstrated the particular utility of betweenness centrality for prioritizing ASD risk genes from large genomic datasets. Remori et al. developed a systems biology approach that leveraged betweenness centrality to analyze PPI networks generated from ASD-associated genes, successfully prioritizing novel candidate genes including CDC5L, RYBP, and MEOX2 [35]. Their method involved mapping genes from copy number variations (CNVs) of unknown significance onto PPI networks and ranking them by betweenness centrality scores, revealing significant enrichment in pathways like ubiquitin-mediated proteolysis and cannabinoid receptor signaling [35].
In a complementary approach, Zhang et al. developed PANDA (Prioritization of Autism-genes using Network-based Deep-learning Approach), which integrated multiple network features including topological similarity and gene-gene interaction patterns [90]. While PANDA employed a deep learning classifier, their work acknowledged the importance of network centrality measures for capturing essential gene properties relevant to ASD pathogenesis.
The differentiation between centrality measures is supported by correlation studies across diverse networks. Valente et al. found that while some centrality measures show strong correlations, each captures unique aspects of network position, with betweenness centrality often remaining relatively distinct from degree and closeness measures [91]. This theoretical distinction confirms the value of applying multiple centrality measures to gain complementary insights into gene function.
Experimental Protocols and Workflows
Protocol for Betweenness Centrality-Based Gene Prioritization in ASD
This protocol outlines a standardized workflow for implementing betweenness centrality analysis for ASD gene prioritization, based on methodologies from recent literature [35] [92].
Step 1: Network Construction
- Obtain protein-protein interaction data from validated databases (e.g., STRING, BioGRID)
- Filter interactions by confidence score (e.g., ≥700 in STRING) [92]
- Map protein identifiers to standardized gene identifiers (e.g., Entrez Gene IDs)
- Construct network with genes as nodes and interactions as edges
Step 2: Seed Gene Selection
- Compile ASD risk genes from authoritative databases (e.g., SFARI Gene)
- Categorize genes by evidence strength (e.g., syndromic, high confidence, strong candidate)
- Create seed gene list for network initialization
Step 3: Betweenness Centrality Calculation
- Implement betweenness centrality algorithm using network analysis tools (e.g., NetworkX, igraph)
- Calculate shortest paths between all node pairs using BFS for unweighted or Dijkstra for weighted networks
- Compute betweenness scores for all nodes: ( CB(v) = \sum{s \neq v \neq t} \frac{\sigma{st}(v)}{\sigma{st}} )
- Normalize scores for network size: ( CB'(v) = \frac{CB(v)}{(N-1)(N-2)/2} ) for directed graphs
Step 4: Gene Prioritization and Validation
- Rank genes by betweenness centrality scores
- Select top candidates for functional enrichment analysis
- Validate through over-representation analysis in biological pathways
- Compare with known ASD-associated pathways and mechanisms
Workflow Visualization: Betweenness Centrality in ASD Gene Discovery
Diagram 1: Workflow for betweenness centrality-based ASD gene prioritization, integrating PPI networks and known ASD genes to identify novel candidates and enriched pathways.
Comparative Analysis Protocol
To systematically compare centrality measures for ASD gene prioritization, researchers should implement this standardized protocol:
Step 1: Unified Network Framework
- Use identical PPI network and seed genes for all centrality measures
- Ensure consistent normalization across measures
Step 2: Parallel Implementation
- Calculate betweenness, degree, and eigenvector centrality scores
- Use same computational environment for fair comparison
Step 3: Evaluation Metrics
- Assess overlap in top-ranked genes between measures
- Validate against known ASD gene sets (e.g., SFARI Gene)
- Perform functional enrichment analysis for each gene set
- Evaluate biological coherence of results
Step 4: Integration Approaches
- Develop combined scores weighting different centrality measures
- Implement machine learning approaches (e.g., PANDA) that integrate multiple network features [90]
The Scientist's Toolkit: Research Reagent Solutions
Table 3: Essential Resources for Network-Based ASD Gene Prioritization
| Resource Category | Specific Tools/Databases | Function in Analysis | Application Notes |
|---|---|---|---|
| PPI Databases | STRING [92], BioGRID, IntAct | Provides physical and functional interactions for network construction | Use confidence scores ≥700; map to standardized gene identifiers |
| ASD Gene Resources | SFARI Gene [35] [90] [92], AutDB | Curated ASD risk genes for seed lists and validation | Categorize by evidence strength (S, 1, 2, 3, 4, 5) |
| Network Analysis Tools | NetworkX, igraph, Cytoscape | Calculate centrality measures and visualize networks | Use optimized algorithms for large networks (>10,000 nodes) |
| Pathway Analysis | g:Profiler, Enrichr, DAVID | Functional enrichment analysis of prioritized genes | Focus on neuronal development, synapsis, chromatin modification |
| Programming Environments | R, Python with specialized libraries (e.g., tensorflow for PANDA [90]) | Implement custom analysis pipelines and algorithms | Ensure reproducibility through containerization (Docker, Singularity) |
Discussion: Implications for ASD Drug Development
The application of betweenness centrality in ASD gene prioritization offers distinct advantages for identifying therapeutic targets. Unlike degree centrality, which identifies locally connected hubs, betweenness centrality pinpoints genes that occupy strategically important positions as bridges between network modules [36] [86]. These "bottleneck" genes may represent higher-value therapeutic targets because their perturbation could potentially influence multiple biological processes relevant to ASD pathophysiology.
The systems biology approach employing betweenness centrality has successfully identified novel ASD candidate genes such as CDC5L, RYBP, and MEOX2 [35], which were subsequently validated through pathway enrichment analyses showing significant association with biological processes including ubiquitin-mediated proteolysis and cannabinoid receptor signaling. These findings not only expand the catalog of potential ASD risk genes but also reveal novel mechanistic pathways that might be targeted therapeutically.
For drug development professionals, network-based prioritization strategies offer a powerful approach to triage the numerous genetic variants typically identified in genomic studies. By focusing resources on genes with strategic network positions, betweenness centrality provides a biologically-informed filter for identifying the most promising therapeutic targets from large-scale genetic datasets. Furthermore, the bridge genes identified through betweenness centrality may represent points of convergence in ASD pathogenesis, potentially explaining how diverse genetic alterations can lead to similar clinical manifestations.
This application note details a suite of bioinformatic and experimental protocols designed for the functional validation of candidate genes prioritized through network-based approaches, such as betweenness centrality analysis in Protein-Protein Interaction (PPI) networks. Within the broader thesis context of gene prioritization in autism spectrum disorder (ASD) research, these methods bridge computational prediction with biological insight by assessing a gene's involvement in established ASD pathways and its co-expression patterns with known ASD risk genes. This validation is crucial for translating prioritized gene lists, often derived from noisy genomic data like variants of uncertain significance (VUS), into credible biological candidates for further mechanistic studies and therapeutic targeting [2] [92].
The functional validation pipeline is built upon two complementary pillars: pathway enrichment analysis and co-expression network analysis. Key quantitative findings from exemplary studies are summarized below.
Table 1: Summary of Key Validation Metrics from Referenced Studies
| Analysis Type | Study Focus | Key Metric/Result | Implication for Validation |
|---|---|---|---|
| Pathway Enrichment | ASD Etiology (GSE18123) | GO/KEGG enrichment of 446 DEGs revealed processes like synaptic function and immune response [28]. | Confirms that discovered DEGs are biologically relevant to known ASD mechanisms. |
| Pathway Enrichment | Systems Biology Prioritization | ORA of prioritized genes showed enrichment in ubiquitin-mediated proteolysis and cannabinoid receptor signaling [2]. | Identifies novel, potentially perturbed pathways beyond core neurodevelopmental functions. |
| Pathway Enrichment | ASD & Sleep Disturbance Comorbidity | HALLMARK/GSEA identified oxidative stress, neurodevelopment, and immune responses as shared pathways [93]. | Validates candidate genes (e.g., LAMC3) by linking them to pathways relevant to co-occurring conditions. |
| Pathway Enrichment | Immune Dysregulation in ASD | Enrichment analysis tied a 50-gene signature to TNF signaling pathways [94]. | Provides a specific, immune-related mechanistic context for validating immune-focused candidate genes. |
| Co-expression | 22q13 Deletion Syndrome (PMS) | WGCNA on BrainSpan data identified modules housing known (SHANK3) and novel candidate genes (EP300, TCF20) for PMS phenotypes [95]. | Validates candidates by their network proximity and shared expression with high-confidence risk genes. |
| Co-expression | Dizygotic Twins ASD Study | Co-expression modules were enriched with SFARI Category 1–2 genes [96]. | Supports the disease-relevance of alternatively spliced genes via their co-expression network. |
| Subtype-Specific Pathways | ASD Subtyping (SPARK) | Each of the four phenotypic classes showed minimal overlap in impacted biological pathways (e.g., neuronal action potentials, chromatin organization) [64] [65]. | Demands that validation considers ASD heterogeneity; a gene's role may be subtype-specific. |
Detailed Experimental Protocols
Protocol 1: Pathway Enrichment Analysis for Candidate Gene Validation
Objective: To determine if a prioritized list of genes is statistically overrepresented in biological pathways, Gene Ontology (GO) terms, or gene sets known to be implicated in ASD.
Materials & Software: R Statistical Environment, Bioconductor packages (clusterProfiler, enrichplot), gene set databases (MSigDB HALLMARK, KEGG, GO), candidate gene list.
Procedure:
- Gene List Preparation: Compile the finalized list of candidate genes (e.g., top-ranked genes by betweenness centrality) using standard gene symbols.
- Background Definition: Define an appropriate background gene list. Typically, this is the set of all genes expressed in the relevant tissue (e.g., brain) or all genes present on the analysis platform (e.g., microarray).
- Enrichment Analysis Execution: a. Over-Representation Analysis (ORA): For discrete candidate lists. b. Gene Set Enrichment Analysis (GSEA): For ranked gene lists (e.g., by expression fold-change or centrality score).
- Result Interpretation & Validation:
- Statistically significant terms (adjusted p-value < 0.05) related to ASD (e.g., "synaptic signaling," "chromatin remodeling," "immune response") provide strong functional validation [28] [2].
- Cross-reference enriched pathways with those identified in ASD subclasses (e.g., prenatal vs. postnatal active pathways [65]) or comorbidities (e.g., sleep disturbance [93]) for refined biological context.
- Visualize results using dot plots, enrichment maps, or cnet plots from the
enrichplotpackage.
Protocol 2: Weighted Gene Co-Expression Network Analysis (WGCNA)
Objective: To identify modules of highly co-expressed genes from transcriptomic data and validate candidates by their presence in modules enriched with known ASD genes or correlated with clinical traits.
Materials & Software: R package WGCNA, normalized gene expression matrix (e.g., from RNA-seq or microarray), clinical trait data (optional).
Procedure:
- Data Input & Preprocessing: Load a normalized, filtered expression matrix. Check for excessive missing values and outliers.
- Network Construction: a. Choose a soft-thresholding power (β) that ensures a scale-free topology (scale-free R² > 0.85). b. Construct the adjacency matrix and transform it into a Topological Overlap Matrix (TOM).
- Module Detection: Perform hierarchical clustering on the dissTOM and dynamically cut the tree to define gene modules.
- Validation via Module-Trait & Enrichment Analysis: a. Correlate module eigengenes (MEs) with clinical traits (e.g., diagnosis, severity scores) to identify relevant modules. b. Extract genes from significant modules and perform pathway enrichment (Protocol 1). c. Core Validation Step: Intersect the candidate gene list with genes from disease-relevant modules. Calculate the enrichment of known SFARI genes (Score 1-3) within the candidate's module. Significant enrichment validates the candidate's placement in a biologically meaningful ASD-associated network [95] [96].
- Hub Gene Identification: Within the validated module, calculate module membership (kME). Candidates with high kME are intramodular hubs, suggesting functional importance.
Protocol 3: Integration with Subtype-Specific Contexts
Objective: To contextualize validation findings within the framework of biologically distinct ASD subtypes.
Materials & Software: Phenotypic classification data (e.g., subtype labels from studies like [64] [65]), subtype-specific genetic or expression data.
Procedure:
- Subtype Annotation: If available, annotate the source samples or prior genetic data used for prioritization with ASD subtype classifications (e.g., "Social and Behavioral Challenges," "Broadly Affected").
- Stratified Analysis: Perform pathway enrichment (Protocol 1) or co-expression analysis (Protocol 2) separately for each subtype cohort.
- Comparative Validation: Assess if the candidate gene's functional associations (pathways, co-expression partners) are global or specific to a subtype. For instance, a gene may be enriched in "chromatin organization" pathways specific to a subtype with developmental delay [65]. This provides a more precise, clinically relevant validation.
Visualizations
Figure 1: Functional Validation Workflow for Prioritized ASD Genes
Figure 2: ASD Subtypes and Their Associated Biological Pathways
The Scientist's Toolkit: Research Reagent Solutions
Table 2: Essential Resources for Functional Validation in ASD Gene Prioritization Research
| Category | Reagent/Resource | Function in Validation | Example/Source |
|---|---|---|---|
| Gene & Pathway Databases | SFARI Gene Database | Gold-standard reference for known ASD risk genes; used for enrichment checks and co-expression partner validation [2] [92]. | https://gene.sfari.org/ |
| Gene Ontology (GO) / KEGG / HALLMARK | Curated gene sets for pathway over-representation and enrichment analysis [28] [93]. | MSigDB, clusterProfiler R package | |
| Interaction & Network Tools | STRING Database | Source of protein-protein interactions for constructing PPI networks used in initial prioritization and pathway mapping [28] [92]. | https://string-db.org/ |
| Cytoscape | Open-source platform for visualizing and analyzing molecular interaction networks and pathways [28]. | https://cytoscape.org/ | |
| Analysis Software & Packages | R Statistical Environment with Bioconductor | Core platform for executing differential expression, enrichment (clusterProfiler), and co-expression (WGCNA) analyses [28] [93]. |
https://www.r-project.org/, https://bioconductor.org/ |
| WGCNA R Package | Specifically for constructing weighted gene co-expression networks and identifying functional modules [93] [95]. | Available on CRAN | |
| Validation Datasets | BrainSpan Atlas | Developmental transcriptome data of the human brain; essential for WGCNA in neurodevelopmental contexts [95]. | http://www.brainspan.org/ |
| GEO Datasets (e.g., GSE18123) | Public repository for transcriptomic data from ASD and control samples; used for independent validation of expression or co-expression patterns [28] [93]. | https://www.ncbi.nlm.nih.gov/geo/ | |
| Subtyping Frameworks | SPARK Phenotypic Data | Large-scale, detailed phenotypic data enabling the contextualization of genetic findings within defined ASD subtypes [64] [65]. | Simons Foundation |
| Multi-omics Integration | Single-cell RNA-seq Platforms | Allows validation of candidate gene expression and pathway activity in specific cell types (e.g., microglia, neurons) within ASD [94]. | 10x Genomics, etc. |
| Chemical Perturbation Reference | Connectivity Map (CMap) | Database of gene expression profiles following drug treatment; can predict potential therapeutics that reverse candidate gene signature [28] [93]. | https://clue.io/ |
Conclusion
Betweenness centrality offers a powerful, systems-level approach for prioritizing ASD risk genes, effectively managing the heterogeneity and noise inherent in large genomic datasets. By identifying genes that act as critical communication bridges in biological networks, this method has successfully uncovered novel candidates and implicated non-canonical pathways like ubiquitin-mediated proteolysis and cannabinoid signaling in ASD pathophysiology. Future efforts should focus on multi-optic integration, combining PPI network data with spatiotemporal brain expression patterns and gene-level constraint metrics to improve predictive specificity. For clinical translation, validated gene modules provide a roadmap for understanding shared biological mechanisms in co-occurring conditions like epilepsy and offer new potential targets for therapeutic development. As computational methods evolve, the synergy between network-based prioritization and experimental validation will be crucial for unraveling the full genetic landscape of autism.
References
- 1. A study of genetic heterogeneity in autism spectrum disorders ... [https://pmc.ncbi.nlm.nih.gov/articles/PMC10518435/]
- 2. A Systems Biology Approach for Prioritizing ASD Genes in ... [https://pmc.ncbi.nlm.nih.gov/articles/PMC11900372/]
- 3. Decomposition of phenotypic heterogeneity in autism ... [https://www.nature.com/articles/s41588-025-02224-z]
- 4. A network-based method for associating genes with autism ... [https://www.frontiersin.org/journals/bioinformatics/articles/10.3389/fbinf.2024.1295600/full]
- 5. Protein-protein interaction networks (PPI) and complex diseases [https://pmc.ncbi.nlm.nih.gov/articles/PMC4017556/]
- 6. Overview of methods for characterization and visualization of ... [https://pmc.ncbi.nlm.nih.gov/articles/PMC9494275/]
- 7. Protein–protein interaction [https://en.wikipedia.org/wiki/Protein%E2%80%93protein_interaction]
- 8. Hybrid deep learning method to identify key genes in autism ... [https://pmc.ncbi.nlm.nih.gov/articles/PMC12023764/]
- 9. Game theoretic centrality: a novel approach to prioritize ... [https://bmcbioinformatics.biomedcentral.com/articles/10.1186/s12859-020-03693-1]
- 10. Identification of the Key Genes of Autism Spectrum Disorder ... [https://pmc.ncbi.nlm.nih.gov/articles/PMC8343959/]
- 11. Recent Developments in Autism Genetic Research [https://www.mdpi.com/2073-4425/13/9/1646]
- 12. Gene Association Classification for Autism Spectrum ... [https://www.mdpi.com/2076-3417/13/15/8980]
- 13. A Systems Biology Approach for Prioritizing ASD Genes in ... [https://www.mdpi.com/1422-0067/26/5/2078/review_report]
- 14. Unveiling the multitarget mechanism of Liuwei Dihuang ... [https://www.nature.com/articles/s41598-025-28204-1]
- 15. Network-based drug repurposing for psychiatric disorders ... [https://pmc.ncbi.nlm.nih.gov/articles/PMC12648111/]
- 16. The Evolving Landscape of Functional Models of Autism ... [https://pmc.ncbi.nlm.nih.gov/articles/PMC12190894/]
- 17. Emerging roles for E3 ubiquitin ligases in neural ... [https://www.frontiersin.org/journals/cell-and-developmental-biology/articles/10.3389/fcell.2025.1557653/full]
- 18. Autism spectrum disorders: an updated guide for genetic ... [https://pmc.ncbi.nlm.nih.gov/articles/PMC5609623/]
- 19. SFARI Gene - Welcome [https://gene.sfari.org/]
- 20. Getting Started - User guide - SFARI Gene [https://gene.sfari.org/user-guide/getting-started/]
- 21. About the Gene Scoring Module [https://gene.sfari.org/about-gene-scoring/]
- 22. Gene Scoring Module [https://gene.sfari.org/database/gene-scoring/]
- 23. SFARI Gene to introduce EAGLE, a new ASD-relevance ... [https://www.sfari.org/2021/12/10/sfari-gene-to-introduce-eagle-a-new-asd-relevance-gene-scoring-system/]
- 24. Identification and Validation Novel Risk Genes for Autism ... [https://jpbs.hapres.com/htmls/JPBS_884_Detail.html]
- 25. Autism spectrum disorder Project [https://thebiogrid.org/project/8/autism-spectrum-disorder.html]
- 26. Construction and contextualization approaches for protein ... [https://pmc.ncbi.nlm.nih.gov/articles/PMC9251778/]
- 27. Integrated systems analysis reveals a molecular network ... [https://pmc.ncbi.nlm.nih.gov/articles/PMC4300495/]
- 28. Integrating Network Analysis and Machine Learning ... [https://pmc.ncbi.nlm.nih.gov/articles/PMC12469866/]
- 29. Multiplex gene and phenotype network to characterize ... [https://www.nature.com/articles/s41598-020-78654-y]
- 30. 2.3. Protein-protein interaction (PPI) network construction ... [https://bio-protocol.org/exchange/minidetail?id=7586729&type=30]
- 31. How to choose colors for data visualizations [https://www.atlassian.com/data/charts/how-to-choose-colors-data-visualization]
- 32. Best Color Palettes for Scientific Figures and Data ... [https://www.simplifiedsciencepublishing.com/resources/best-color-palettes-for-scientific-figures-and-data-visualizations]
- 33. Drug development for Autism Spectrum Disorder (ASD) [https://pmc.ncbi.nlm.nih.gov/articles/PMC10062405/]
- 34. M55. A PHENOTYPE-BASED APPROACH FOR ... [https://www.sciencedirect.com/science/article/pii/S0924977X25004006]
- 35. A Systems Biology Approach for Prioritizing ASD Genes in ... [https://pubmed.ncbi.nlm.nih.gov/40076702/]
- 36. Betweenness Centrality and Other Essential ... [https://memgraph.com/blog/betweenness-centrality-and-other-centrality-measures-network-analysis]
- 37. Betweenness Centrality - Neo4j Graph Data Science [https://neo4j.com/docs/graph-data-science/current/algorithms/betweenness-centrality/]
- 38. Copy Number Variation (CNV) Analysis: A Guide for ... [https://pages.bionano.com/copy-number-variant-cnv-analysis]
- 39. Ranking Plant Network Nodes Based on Their Centrality ... [https://pmc.ncbi.nlm.nih.gov/articles/PMC10137616/]
- 40. Ranking cancer drivers via betweenness-based outlier ... [https://bmcbioinformatics.biomedcentral.com/articles/10.1186/s12859-021-03989-w]
- 41. An integrative scoring approach for prioritization of rare ... [https://www.nature.com/articles/s41598-025-96063-x]
- 42. Prioritizing de novo autism risk variants with calibrated gene [https://pmc.ncbi.nlm.nih.gov/articles/PMC8938308/]
- 43. ESC models of autism with copy-number variations reveal ... [https://www.sciencedirect.com/science/article/pii/S2666979X25001338]
- 44. Over-representation analysis - RNA-Seq - GitHub Pages [https://alexslemonade.github.io/refinebio-examples/03-rnaseq/pathway-analysis_rnaseq_01_ora.html]
- 45. Nine quick tips for pathway enrichment analysis - PMC [https://pmc.ncbi.nlm.nih.gov/articles/PMC9371296/]
- 46. GSEA vs ORA: Two key pathway analysis approach... [https://pluto.bio/resources/Learning%20Series/gsea-vs-ora-two-key-pathway-analysis-approaches-for-next-gen-sequencing-data]
- 47. Pathway enrichment analysis and visualization of omics data ... [https://pmc.ncbi.nlm.nih.gov/articles/PMC6607905/]
- 48. Over-Representation Analysis with ClusterProfiler [https://learn.gencore.bio.nyu.edu/rna-seq-analysis/over-representation-analysis/]
- 49. Chapter 15 Visualization of functional enrichment result [https://yulab-smu.top/biomedical-knowledge-mining-book/enrichplot.html]
- 50. Text mining of gene–phenotype associations reveals new ... [https://www.nature.com/articles/s41598-021-94742-z]
- 51. Implication of Akt‐dependent Prp19α/14‐3‐3β/Cdc5L ... [https://ouci.dntb.gov.ua/en/works/40M1EOAl/]
- 52. Identification of a molecular network regulated by multiple ... [https://pmc.ncbi.nlm.nih.gov/articles/PMC11190613/]
- 53. Customized Chromosomal Microarrays for ... [https://pmc.ncbi.nlm.nih.gov/articles/PMC12385676/]
- 54. Protein networks identified in autism-linked genetic deletion [https://www.thetransmitter.org/spectrum/protein-networks-identified-in-autism-linked-genetic-deletion/]
- 55. Gene set enrichment analysis indicates convergence in the ... [https://www.sciencedirect.com/science/article/pii/S2772528623000043]
- 56. Gene network analysis identifies dysregulated pathways in ... [https://www.nature.com/articles/s41598-025-89334-0]
- 57. In silico Gene Set and Pathway Enrichment Analyses ... [https://pmc.ncbi.nlm.nih.gov/articles/PMC8093449/]
- 58. Curation of causal interactions mediated by genes ... [https://www.nature.com/articles/s41380-023-02317-3]
- 59. Integrated analysis of molecular atlases unveils modules ... [https://www.nature.com/articles/s41593-025-01933-2]
- 60. Neuron-specific protein network mapping of autism risk ... [https://www.sciencedirect.com/science/article/pii/S2211124722015522]
- 61. Autism Spectrum Disorder Genes: Disease-Related Networks ... [https://pmc.ncbi.nlm.nih.gov/articles/PMC9206533/]
- 62. Spatial Transcriptomics Reveals Regional and Temporal ... [https://pmc.ncbi.nlm.nih.gov/articles/PMC12189371/]
- 63. De novo network analysis reveals autism causal genes ... [https://www.life-science-alliance.org/content/6/10/e202302142]
- 64. New Study Reveals Subclasses of Autism by Linking Traits ... [https://www.simonsfoundation.org/2025/07/09/new-study-reveals-subclasses-of-autism-by-linking-traits-to-genetics/]
- 65. Major autism study uncovers biologically distinct subtypes, ... [https://www.princeton.edu/news/2025/07/09/major-autism-study-uncovers-biologically-distinct-subtypes-paving-way-precision]
- 66. Genomic analysis of 116 autism families strengthens ... [https://www.nature.com/articles/s41525-024-00411-1]
- 67. A Survey of Gene Prioritization Tools for Mendelian and ... [https://pmc.ncbi.nlm.nih.gov/articles/PMC7074139/]
- 68. : a novel approach to prioritize disease... Game theoretic centrality [https://pmc.ncbi.nlm.nih.gov/articles/PMC7430867/]
- 69. Genetic and environmental influences in autism [https://pmc.ncbi.nlm.nih.gov/articles/PMC12618061/]
- 70. Betweenness Centrality - an overview [https://www.sciencedirect.com/topics/computer-science/betweenness-centrality]
- 71. Improving Graph Machine Learning Performance Through ... [https://arxiv.org/html/2405.03706v1]
- 72. Network diffusion with centrality measures to identify ... [https://www.aimspress.com/article/doi/10.3934/mbe.2021147?viewType=HTML]
- 73. DeepGenePrior: A deep learning model for prioritizing genes ... [https://journals.plos.org/ploscompbiol/article?id=10.1371/journal.pcbi.1011249]
- 74. SFARI genes and where to find them; modelling Autism ... [https://www.nature.com/articles/s41598-022-14077-1]
- 75. Human Gene Module [https://gene.sfari.org/database/human-gene/]
- 76. Simons Searchlight July 2025 Update: New Phenotypic ... [https://www.sfari.org/2025/07/30/simons-searchlight-july-2025-update-new-phenotypic-data-available/]
- 77. A closer look at cross-validation for assessing the accuracy ... [https://www.nature.com/articles/s41598-018-24937-4]
- 78. A network-based method for associating genes with autism ... [https://pmc.ncbi.nlm.nih.gov/articles/PMC10960359/]
- 79. A large-scale benchmark of gene prioritization methods [https://www.nature.com/articles/srep46598]
- 80. Network-based features enable prediction of essential genes ... [https://pmc.ncbi.nlm.nih.gov/articles/PMC6292609/]
- 81. A phenotype centric benchmark of variant prioritisation tools [https://www.nature.com/articles/s41525-018-0044-9]
- 82. A Machine Learning Approach to Predicting Autism Risk ... [https://www.frontiersin.org/journals/genetics/articles/10.3389/fgene.2020.500064/full]
- 83. Two betweenness centrality measures based on ... [https://www.nature.com/articles/srep19668]
- 84. Network centrality analysis of eye-gaze data in autism ... [https://www.sciencedirect.com/science/article/abs/pii/S001048251930201X]
- 85. Network Centrality: Understanding Degree, Closeness & ... [https://visiblenetworklabs.com/2021/04/16/understanding-network-centrality/]
- 86. Centrality Measure - an overview | ScienceDirect Topics [https://www.sciencedirect.com/topics/computer-science/centrality-measure]
- 87. Degree Centrality - an overview | ScienceDirect Topics [https://www.sciencedirect.com/topics/computer-science/degree-centrality]
- 88. Eigenvector centrality [https://en.wikipedia.org/wiki/Eigenvector_centrality]
- 89. Linking the network centrality measures closeness and ... [https://www.nature.com/articles/s42005-022-00949-5]
- 90. PANDA: Prioritization of autism - genes using network -based... [https://pubmed.ncbi.nlm.nih.gov/32039500/]
- 91. How Correlated Are Network Centrality Measures? - PMC [https://pmc.ncbi.nlm.nih.gov/articles/PMC2875682/]
- 92. Frontiers | Network Diffusion-Based Prioritization of Autism Risk... [https://www.frontiersin.org/journals/genetics/articles/10.3389/fgene.2017.00129/full]
- 93. Exploring the molecular mechanisms of comorbidity between ... [https://pmc.ncbi.nlm.nih.gov/articles/PMC12643707/]
- 94. A multi-omics approach reveals dysregulated TNF-related ... [https://www.nature.com/articles/s41435-025-00349-z]
- 95. Brain Gene Co-Expression Network Analysis Identifies 22q13 ... [https://pubmed.ncbi.nlm.nih.gov/38002941/]
- 96. Alternative splicing and gene co-expression network ... [https://www.sciencedirect.com/science/article/pii/S0888754321002123]